Production Costs and Returns by Region
Author
Published
10/14/2022
Different regions of the country produce different agricultural products. While things like weather, land quality, and market availability are all factors in production decision, ultimately the most profitable products in a region will be growth by farmers in that region.
Estimated production costs and returns for various commodities are published by the USDA annually. When publishing these returns the USDA publishes estimates for farm resource regions, which are regions identified by USDA based on agricultural specialization. Figure 1 shows the farm resource regions used by the USDA-ERS.
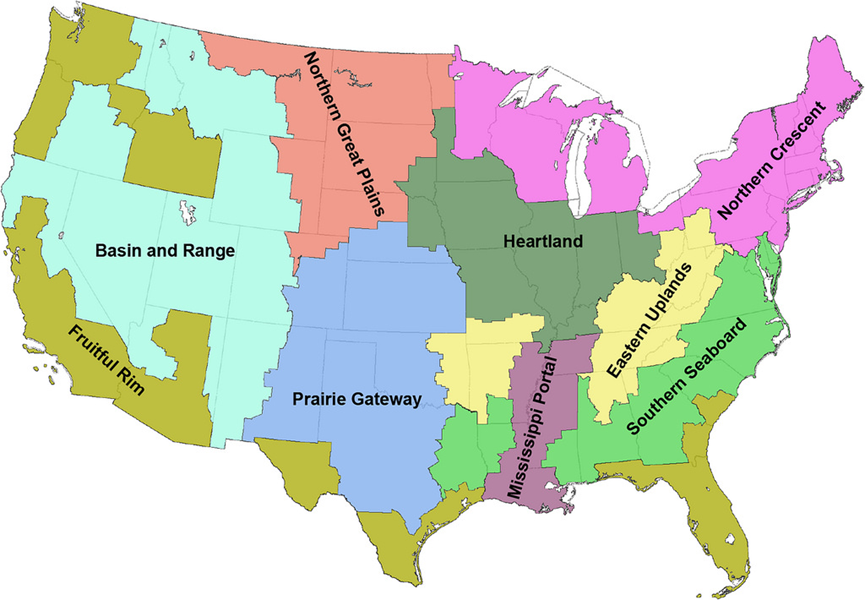
Figure 1. USDA Farm Resource Regions
Reported costs are broken down into two different categories, operating and fixed. Operating costs are costs that are used as inputs and that would not be incurred if production stopped. Examples are things like seed or feed. Fixed costs are incurred whether you are producing the commodity or not. They include things like insurance, taxes, and capital costs like land and machinery.
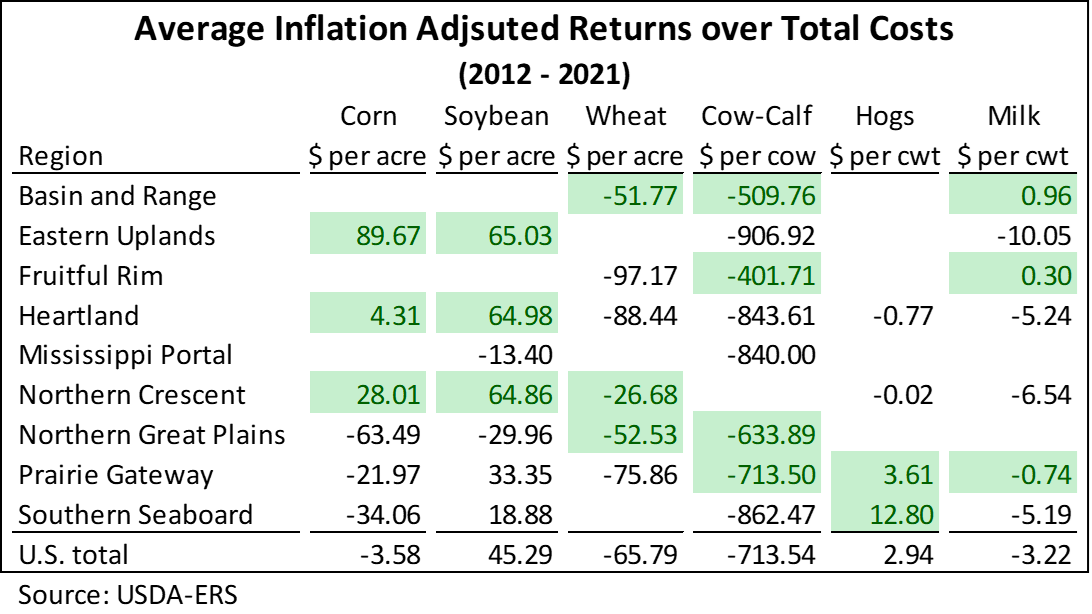
Tables 1 and Table 2 show USDA the average estimated returns above operating costs and returns above total costs of major commodities produced in the U.S. over the last 10 years. In both tables, regions with returns higher than the U.S. average are highlighted in green, as producers in these regions have an advantage in producing the commodity compared to producers in other regions who face lower returns on average.
Some of the numbers in Table 2 are negative. The USDA includes opportunity costs in their calculation. For example, a rent charge for land is included even if land that is bought and paid off. The rent charge is the opportunity cost of the land.
Certain industries could post strong cash returns but may not be covering all opportunity costs, making the returns over total costs appear negative.
Table 1. Average Returns over Operating Costs (2012 - 2021)
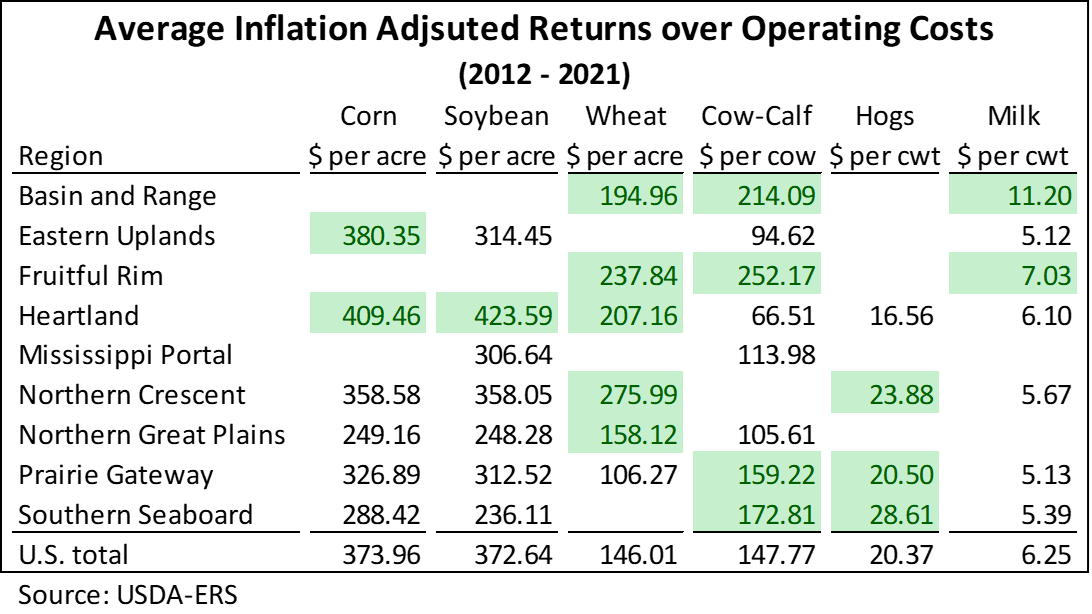
Table 2. Average Returns over Total Costs (2012 - 2021)
Areas with relatively better returns are expected to have more production. Producers want to raise what they can make money raising, so regions with more acres of a certain crop or more head of a certain animal typically have a cost advantage. This expectation holds for some commodities, but does not explain all production differences across different regions of the U.S.
The Heartland region, which contains Iowa, produces the most corn and soybeans of all U.S. regions. As expected, the Heartland region has returns higher than the U.S. average for these commodities. Surprisingly, the Eastern Uplands are reported to have the highest returns on corn and soybeans. This is due to slightly higher prices and much less expensive land with only slightly lower yields. While both corn and soybeans are grown in the Eastern Uplands this region is not a major producer of either crop. If returns are really this strong, land is likely undervalued in this region.
Looking at wheat, the two largest wheat producing regions are the Prairie Gateway and the Northern Great Plains. The Northern Great Plains appear competitive in wheat production, however the Prairie Gateway has surprisingly low returns. Furthermore, while the Northern Crescent is not a major producer of wheat the estimates show higher returns than other regions of the country. In fact, there is only one year in the last 10 years the data show a larger return in the prairie gate region compared to the Northern Crescent. The Northern Crescent contains higher quality land and larger yields in that area are estimated to cover additional operating and fixed costs.
The livestock industries outlined here also do not always follow the rule that more production is in areas of relatively higher margins.
For example, hogs are concentrated, with the Heartland holding the most hogs. The Southern Seaboard holds the second most hogs of any region but follows the Heartland by a substantial margin. However, estimated average cost of production show the southern seaboard is more competitive than the Heartland.
While beef cattle are more spread out amongst the regions than hogs, but the Prairie Gateway holds the most beef cow inventory. While the Prairie Gateway does have a better margin than the U.S. average, there are other regions that they have better margins including the Fruitful Rim and Basin and Range regions.
The last commodity group outlined above is dairy. Dairy cows are predominantly located in the Fruitful Rim and the Northern Crescent regions. The Fruitful Rim is estimated to have one of the better dairy margins in the country. However, like in other commodities groups, the Northern Crescent looks surprisingly less competitive than other regions of the country.
The profitability of a crop or livestock facility is and will always be the major decider on if and where agricultural commodities are produced. Costs of production and revenues vary in different regions of the country. It is expected that regions with relatively higher margins for a certain commodity would produce more of that commodity. In general, that appears to hold but there are some exceptions to the rule.
In some cases, regions with higher returns do have more production. The Heartland leads in corn and soybean production and while the margins are not the best, they are above the U.S. average. Surprisingly though, some regions that lead in production of some commodities did not have returns better than the U.S. average. The data did not show a large cost advantage for hog production in the Heartland or wheat production in the Prairie Gateway.
Economic analysis provided by Aaron Gerdts, Research Analyst, Decision Innovation Solutions on behalf of Iowa Farm Bureau.
Want more news on this topic? Farm Bureau members may subscribe for a free email news service, featuring the farm and rural topics that interest them most!