Corn Breakevens, Effective Crop Insurance Guarantees, and ECO
Author
Published
3/7/2025
Understanding breakeven prices is a critical component of successful farm and risk management. This price often influences planting rotation decisions, crop insurance coverage, and opportunities to market your crop as prices fluctuate over time.
Crop insurance has become a valuable tool in farm management and current trends of rising input costs and lower grain prices indicate the need for a close review of your 2025 crop insurance policy before the March 17th sales closing date.
Acreage productivity and costs in Iowa vary greatly depending on region. The most popular crop insurance coverage level in northern counties is 85% Revenue Protection (RP), and 80% RP in southern counties. The 2025 spring projected price for corn was set at $4.70/bushel and $10.54/bushel for soybeans. The spring projected price for corn is up 4 cents and down $1.01 for soybeans from 2024.
Comparing Breakeven Prices to Effective Coverage Price
Breakeven prices represent the minimum price needed to cover the total cost of production. The breakeven price for northern Iowa was estimated using Iowa State University’s total cost of production estimates for 183 bu/acre Trend Adjusted (TA) yield. The breakeven price for southern counties was calculated for 139 bu/acre TA yield (Table 1). Expectedly, farmers in Calhoun County, and most northern counties, have lower breakeven costs due in part to higher yields comparatively.
The total cost per bushel, or breakeven price, was estimated at $4.85/bushel for northern counties and $5.40/bushel for southern counties (Table 1). These figures are merely estimations and are intended to be representative of regional averages and are not likely to hold for each individual farm. Note that in this analysis all figures and estimations use corn following soybean rotation and premiums are enterprise units.
Table 1: Breakeven price by Iowa region assuming trend average yields
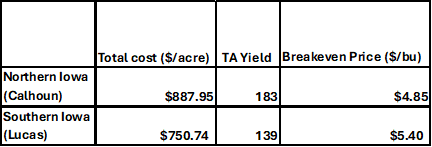
Table 2: Breakdown of effective coverage price by Iowa region

Crop insurance provides farmers with a broad range of safety net options by guaranteeing farmers a portion of expected revenue. The effective coverage price is determined by using the insured price and the premium per bushel. The effective coverage price was estimated at $3.87/bushel and $3.59/bushel for northern and southern counties, respectively (Table 2).
As expected, total costs per bushel are significantly greater in southern counties with lower yields. The estimated effective coverage price in southern counties is an estimated $0.26 lower than that of northern counties. Differences between the effective coverage price and breakeven price are around $1.81 for southern counties and $0.98 for northern counties (Table 3).
Table 3: Summary of estimated price projections assuming trend average yields

The gap between effective coverage price and breakeven price defines how much risk a producer is exposed to with crop insurance in place. For example, the Northern Iowa producer has a gap of $0.98 on 183 bushels per acre which is total exposure of $179.34 per acre. The southern Iowa producer has a gap of $1.81 per bushel on 139 bushels per acre for a total exposure of $251.59 per acre.
Also note, premiums in southern counties (i.e., Lucas), pay an average premium of $23.07/acre for 80% coverage in enterprise units. For northern counties (i.e., Calhoun), their estimated premium cost for 85% coverage is only around $0.12/acre higher than southern counties pay for 80% coverage. The average premium in southern counties at 85% coverage level is about 79% higher at $41.53/acre compared to those in the northern region. If the producer in southern Iowa buys 85% coverage, it does raise their effective coverage price to $3.70 per bushel, but the higher premium also raises their breakeven price to $5.53 per bushel and total risk exposure goes up to $254.59 per acre.
Another view of the risk issue is to ask, “at the current market price and at the effective coverage price, what yields do I need to breakeven?” Table 4 shows the comparison of the yield that would be needed to breakeven at fall market prices and at the effective coverage price and how those yields compare to the APH. At the expected fall market price (minus a 30 cent basis in northern Iowa and a 40 cent basis in southern Iowa) it will take 202 bu/acre to cover total cost of production and 175 bushels per acre in southern Iowa. These represent yields 10% over APH in northern Iowa and nearly 26% over APH in southern Iowa. If prices fall all the way to exactly the effective coverage price, it takes a yield of 229 bu/ac (25% higher than APH) in northern Iowa and 209 bu/ac (50% higher than APH) in southern Iowa to breakeven raising corn for the year. Crop insurance is a great risk management tool, but with prices at the low range of recent years, and costs per acre that are near the top of recent years, there is a meaningful gap between what insurance guarantees and what it costs to raise a crop. Simply put, if prices fall, it takes exceptional yields to cover total input costs.
Table 4. Comparison of APH to breakeven yields at effective coverage price and fall market price

Some farmers may consider boosting their coverage for the upcoming crop year to provide additional financial protection as typical crop insurance guarantees may not cover breakeven costs. For farmers in the northern part of the state, higher yields help lower premiums and total costs per bushel, but effective revenue guarantees are still lower than estimated breakeven costs. While cutting input costs where you are able may be an additional way to lower your breakeven, it may be beneficial to improve your safety net through supplemental products.
Note that starting in 2025, the Enhanced Coverage Option (ECO) subsidy rate is increasing from 44% to 65%. This allows for additional savings on premiums for those who select ECO as farmers will now pay a smaller share of those premiums. Exact ECO premiums are county- and coverage-level dependent.
Assuming that ECO coverage level is 95% with expected county yield at 183 bu/acre for northern counties, and actual farm and county yield at 156 bu/acre at $4.70/bu, the total ECO payment estimate is $77.41/acre with an approximate $15/acre premium (Table 5). Yields below 156 bu/acre provide the same ECO payment in addition to your underlying payment. As shown in Table 5, the same ECO payment estimate of $77.41/acre also kicks in at higher yields for harvest prices lower than $4.70/bu, which are a possibility.
Table 5: ECO payment for northern Iowa; Source: Illinois FarmDoc

Assuming the same ECO coverage level as the example above for southern counties, with an expected county yield at 139 bu/acre, and actual farm and county yields at 118 bu/acre at $4.70/bu, the total ECO payment estimate is $58.80/acre with an estimated premium of $11.45/acre (Table 6). Again, as shown in Table 6, the ECO payment estimate of $58.80/acre also is distributed for lower yields when harvest prices lower than $4.70/bu. Note that the estimated premium is not deducted from the estimated payment.
Table 6: ECO estimated payments for southern Iowa; Source: Illinois FarmDoc

ECO coverage has a separate premium that effectively raises the breakeven price and can be viewed as a parallel to the effective coverage price of RP. The band of ECO coverage extends from 95% (or 90%) coverage down to 85% coverage, providing a range of effective coverage prices of ECO dependent on county-level yields, whereas effective coverage price (RP) is based on individual farm yields. As shown in Table 7, the range of effective coverage of ECO extends from $4.38 down to $3.96 for both northern and southern counties.
Table 7: Comparison of effective coverage of RP and effective coverage price range of ECO

In summary, crop insurance operates essentially like a complicated put option at the effective coverage level but with an increasing strike price if the fall price is higher than the spring price. ECO operates as a put option with a put option at 95% (or 90% if the 90% ECO is chosen) of the spring price with an increasing strike price if the fall price is higher than the spring price. But, ECO additionally has the characteristics of having sold a put option at 86% which also has an increasing strike price if the fall price is higher than the spring price. Price action is the same for both RP and ECO coverage, but the yield triggers are different and, as they say, that complicates things.
Want more news on this topic? Farm Bureau members may subscribe for a free email news service, featuring the farm and rural topics that interest them most!