Update on Trade Between the United States (U.S.) and the United Kingdom (U.K.)
Author
Published
5/22/2023
NOTE: Iowa Farm Bureau will be taking 22 members and staff to the U.K. in June for its annual Market Study Tour. The goal of the trip is to get a better understanding of the impacts of Brexit on U.S., U.K., and E.U. trade and relationships. Please contact Stacy Stevens at sstevens@ifbf.org for information regarding applying for future market study tours.
In 2021, the U.K. exited the E.U.’s legal regime to become an independent entity for trade purposes. In subsequent responses to this, several new trading agreements are now governing U.K. trade with other countries. These include the Trade and Cooperation Agreement (TCA) which governs the relationship between the U.K. and the European Union (E.U.), the negotiation of at least two other free trade agreements (FTAs) (the U.K.-Australia FTA and the U.K.-New Zealand FTA), an application to join the Comprehensive and Progressive Agreement for Trans-Pacific Partnership (CPTPP), and the establishment of the Trade Remedies Authority (TRA) and the issuance of its first decisions.
On May 5, 2020, U.S. Trade Representative Robert Lighthizer and U.K. Secretary of State for International Trade Elizabeth Truss announced the formal launch of trade agreement negotiations between the United States and the United Kingdom. U.S. and U.K. negotiators held four sets of negotiating sessions in May, June, July-August, and September 2020. These talks stalled at the end of the Trump administration, and more recently, the Biden administration appears to have put all bilateral and multi-lateral trade talks on hold until at least June 2023.
In 2021, U.K. GDP was an estimated $3.1 trillion (current market exchange rates); GDP was up by an estimated 7.1%; and the population was 67.3 million. In 2021, the U.S. GDP was $23.3 trillion; GDP was up by 5.8%; and the U.S. population was 331.9 million.
In 2021, the U.S. exported $55.5 billion in goods to the U.K., and the U.S. imported $56.1 billion in goods from the U.K. The U.K. is the 7th largest trade trading partner of the U.S. for goods. The U.S. is the largest trading partner for the U.K. with respect to goods.
Trade in services with the U.K. (exports and imports) totaled an estimated $140.7 billion in 2019. Services exports were $78.3 billion; services imports were $62.3 billion. The U.S. services trade surplus with the U.K. was $16.0 billion in 2019.
According to the Department of Commerce, U.S. exports of goods and services to the U.K. supported an estimated 665 thousand jobs in 2015 (latest data available) (238 thousand supported by goods exports and 427 thousand supported by services exports).
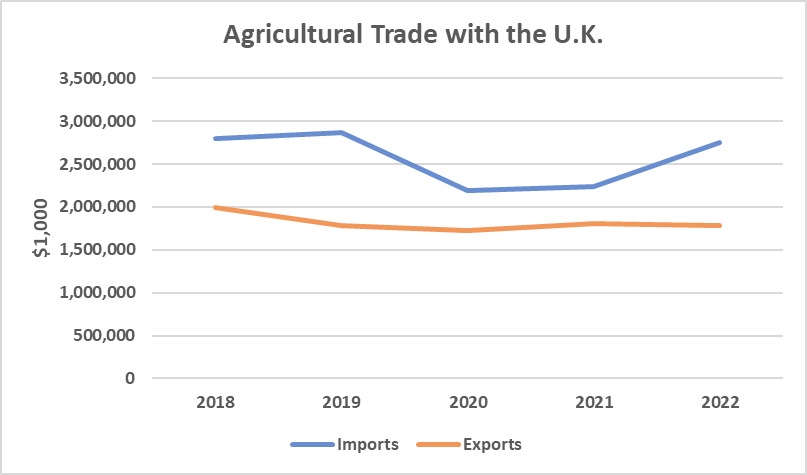
In 2022, agricultural trade specifically with the U.K. was $4.5 billion, with $1.8 billion in U.S. exports of agricultural goods to the U.K. and $2.7 billion of agricultural imports from the U.K. Horticultural products lead the list of trade between the U.S. and the U.K. with the U.S. importing $2.0 billion of horticultural products in 2022 and the U.S. exporting $904 million of horticultural products to the U.K.
In 2022, the U.S. was a net exporter of ethanol, oilseeds, planting seeds, and cotton materials to the U.K. The U.S. was a net importer of horticultural products, grains and feed, sugar, dairy products, poultry products, and tobacco products.
U.S. Agricultural Exports to the U.K. (Value $1,000 USD) | |||||
| 2018 | 2019 | 2020 | 2021 | 2022 |
Product | Value | Value | Value | Value | Value |
Horticultural Products | 1,182,805 | 1,066,871 | 1,026,345 | 975,103 | 904,357 |
Oilseeds & Products | 214,770 | 198,391 | 169,828 | 198,347 | 222,528 |
Grains & Feeds | 238,237 | 170,914 | 163,201 | 167,650 | 180,987 |
Ethanol (non-bev.) | 5,740 | 44,906 | 47,734 | 102,336 | 161,920 |
Sugar & Tropical Products | 123,739 | 136,727 | 122,896 | 134,158 | 144,014 |
Livestock & Meats | 178,043 | 119,541 | 132,111 | 166,200 | 102,177 |
Dairy & Products | 26,431 | 12,463 | 35,294 | 29,553 | 36,950 |
Poultry & Products | 13,682 | 15,906 | 20,643 | 24,760 | 17,863 |
Planting Seeds | 8,870 | 9,581 | 7,903 | 10,921 | 8,346 |
Cotton, Linters & Waste | 1,963 | 1,048 | 729 | 345 | 440 |
Tobacco & Products | 3,759 | 5,304 | 101 | 172 | 346 |
U.S. Agricultural Imports from the U.K. (Value $1,000 USD) | |||||
| 2018 | 2019 | 2020 | 2021 | 2022 |
Product | Value | Value | Value | Value | Value |
Horticultural Products | 2,246,171 | 2,300,222 | 1,603,554 | 1,597,842 | 2,038,896 |
Grains & Feeds | 193,438 | 177,514 | 156,803 | 175,290 | 207,446 |
Sugar & Tropical Products | 119,272 | 135,264 | 213,958 | 189,771 | 149,553 |
Livestock & Meats | 137,117 | 137,996 | 117,855 | 134,406 | 138,563 |
Dairy & Products | 65,343 | 77,767 | 53,965 | 78,652 | 120,509 |
Oilseeds & Products | 25,537 | 21,909 | 28,970 | 44,189 | 70,431 |
Poultry & Products | 6,741 | 8,399 | 9,722 | 19,829 | 20,959 |
Tobacco & Products | 1,662 | 2,106 | 952 | 914 | 1,592 |
Planting Seeds | 1,814 | 1,596 | 1,666 | 1,079 | 1,170 |
Ethanol (non-bev.) | 184 | 105 | 167 | 84 | 32 |
Cotton, Linters & Waste | 256 | 49 | 13 | 9 | 16 |
Want more news on this topic? Farm Bureau members may subscribe for a free email news service, featuring the farm and rural topics that interest them most!