September 2024 WASDE Recap
Author
Published
9/16/2024
Introduction
The USDA released its updated WASDE report on September 12, 2024. The September WASDE is the first report to include objective yield data from the fields in the corn and soybean production estimates.
US corn ending stocks decreased by 55 million bushels and 16 million bushels respectively in the 2023/2024 and 2024/2025 marketing years. Soybean ending stocks decreased by 5 million bushels and 10 million bushels for the 2023/2024 and 2024/2025 marketing years respectively. US wheat ending stocks outperformed market expectations for the 2023/2024 marketing year but remain unchanged for the 2024/2025 marketing year.
Table 1 shows some key report estimates along with trade analyst expectations.
Table 1. September 2024 USDA WASDE vs Market Expectations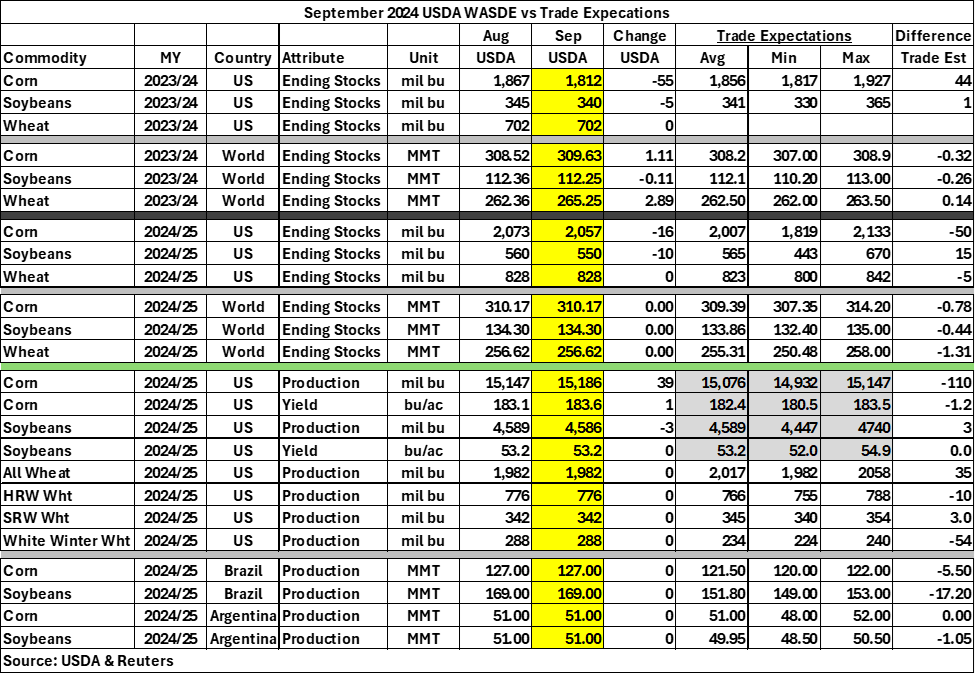
US corn production estimates increased by 39 million bushels in the 2024/2025 marketing year and yield per acre slightly increased by 0.5 bushels per acre. Soybean production estimates decreased by 3 million bushels in the 2024/2025 marketing year, but soybean yield per acre remains unchanged. US Wheat production stayed constant from August to September for the 2024/2025 marketing year.
World corn and wheat ending stocks increased slightly by 1.11 and 2.89 MMT in the 2023/2024 marketing year, while world soybean ending stocks slightly decreased from 112.36 MMT to 112.25 MMT. World corn ending stocks decreased by 16 million bushels and world soybean ending stocks decreased by 10 million bushels in the 2024/2025 marketing year.
The USDA’s Brazil and Argentina corn and soybean production estimates remain unchanged from August to September.
Initial Market Reaction
The immediate market reaction to the USDA reports was mixed. Corn, soybean, wheat prices slightly decreased before quickly increasing. Corn prices increased by 5 cents throughout the day. December corn futures contract prices increased by a penny or two shortly after the WASDE report was released. Soybean prices dropped by 10 cents before weakly recovering by 5 cents. November soybean contract prices dropped by 4 cents on the day before recovering by 11.50 cents throughout the day.
Changes to Domestic Balance Sheets
This section summarizes changes to the corn and soybean balance sheets in more detail.
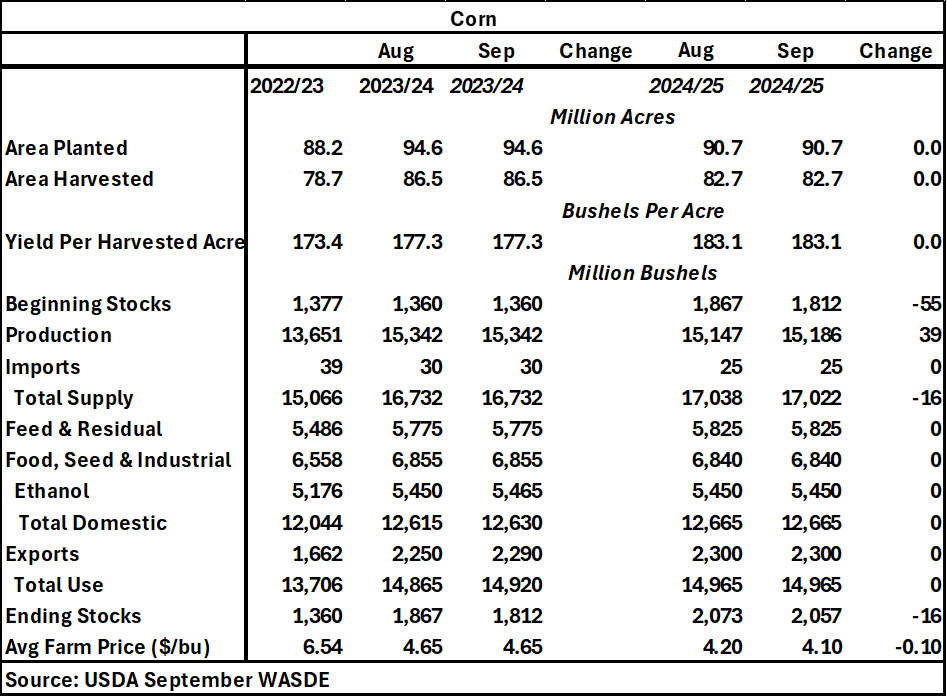
For corn, the only changes in the 2023/2024 marketing year were exports increased by 40 million bushels, total domestic increased by 15 million bushels, total use increased by 55 million bushels, and ending stocks decreased by 55 million bushels. For the 2024/2025 marketing year, area planted, and area harvested stayed constant. The only changes are production increases by 39 million bushels, total supply decreases by 16 million bushels, and ending stocks decreases by 16 million bushels. Total domestic, exports, and total use stayed constant from August to September. Expected average farm prices for 2023/24 were unchanged at $4.65 but decrease from $4.20 to $4.10 for 2024/25.
Table 2. September 2024 WASDE Corn Balance Sheet
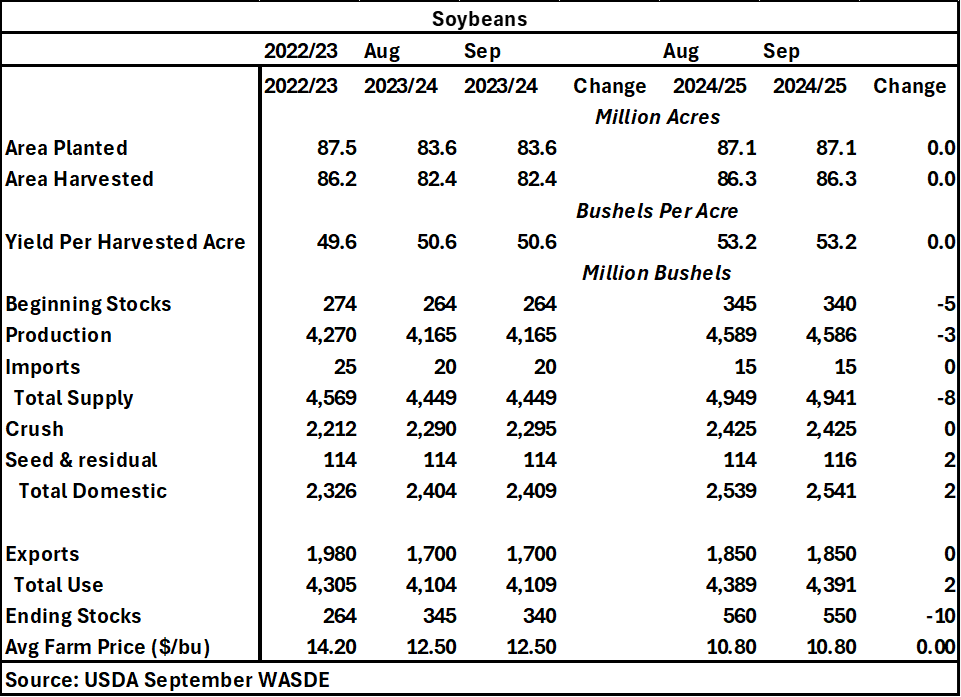
For soybeans, there was a minor change in the 2023/24 balance sheet with total domestic increasing by 5 million bushels, total use increasing by 5 million bushels, and ending stocks decreased by 5 million bushels. For the 2024/25 marketing year, area planted, area harvested, and yields per harvested acre all stayed constant. Production decreases by 3 million bushels and total supply decreases by 8 million bushels. Total domestic and total use increases by 2 million. Ending stocks decrease by 10 million bushels from August to September, while average farm price remains constant.
Table 3. September 2024 WASDE Soybean Balance Sheet
Want more news on this topic? Farm Bureau members may subscribe for a free email news service, featuring the farm and rural topics that interest them most!