September 2024 Quarterly Hog Report: Market Hog Inventory Increases
Author
Published
10/6/2024
Introduction
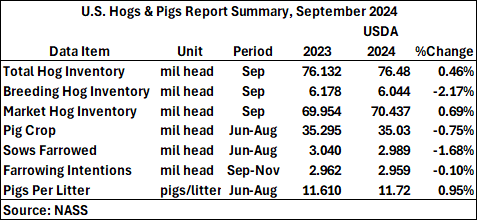
The USDA released its quarterly estimate of the inventory of all hogs and pigs in the U.S. on September 26, 2024. All estimates are for September 1, 2024 or the June-August quarter unless otherwise noted. Table 1 shows key estimates at the US level.
Total hog inventory slightly increased by 0.46%. Breeding hog inventory decreased 2.17% from the same period last year. This was offset by higher litter rates which increased from 11.61 to 11.72 pigs per litter. As seen below, the US pig crop has increased by 2.9% since the previous quarter from 34.02 to 35.03 (mil head). However, this is a slight decrease of 0.75% from the same quarter last year. US hog producers intend to have nearly 2.96 million sows farrow during the September-November quarter.
Table 1. 2024 September Hog Report Statistics for the US
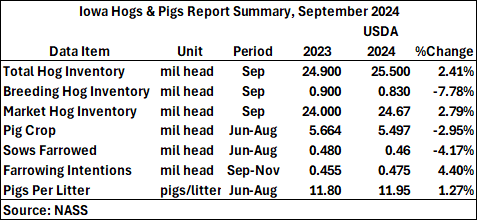
Statistics for Iowa were also included in the report (Table 2). Total hog inventory for Iowa was up 2.41% compared to a year ago, the breeding herd was down 2.17%, and market hog inventory slightly increased by 0.69%. Iowa’s litter rate of 11.95 pigs per litter was above the US litter rate of 11.72 pigs per litter, which continues to reflect the typical relationship.
Table 2. 2024 September Hog Report Statistics for the Iowa
Market Hogs
As mentioned above, US hog inventory is up 0.46% from 76.1 million to 76.5 million year-over-year. Market hogs account for 92% of all US hogs and have increased by 0.69% since last year. This trend is consistent with the continuous decline of the breeding herd (Figure 1) and the nearly continuous increases in sow productivity as measured in pigs per litter.
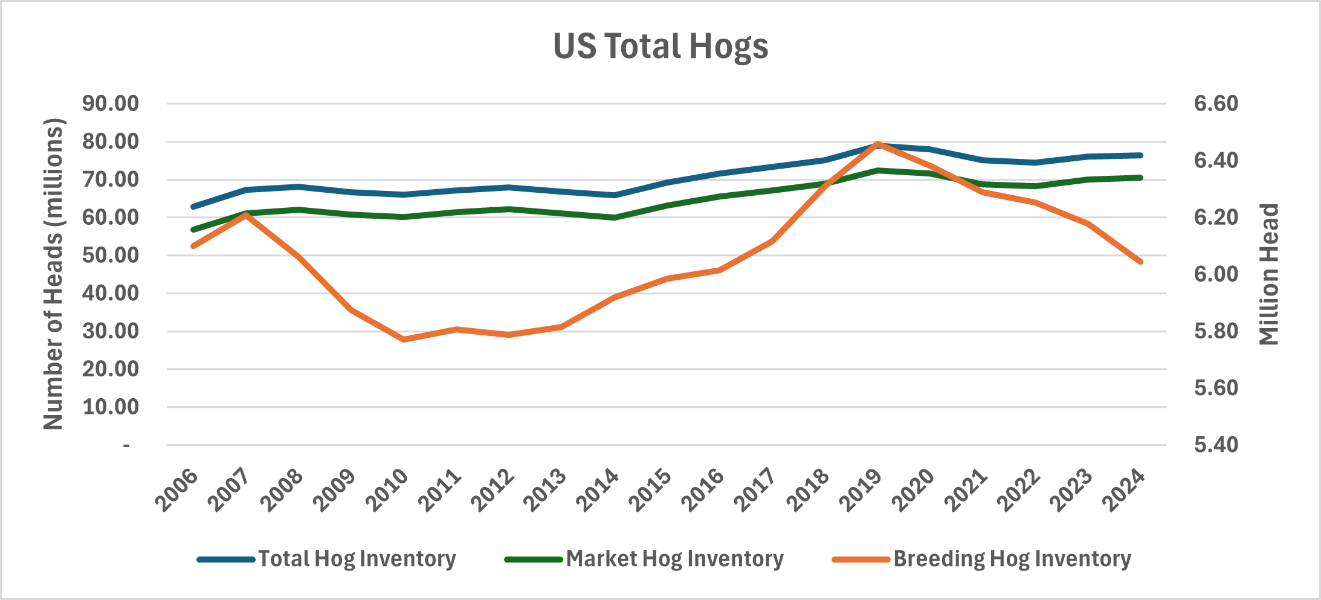
Figure 1. US Total Hogs by June 1st
As the US’ leader in hog production, Iowa’s hog statistics follow the same trend as the US (Figure 2). As of September 1st, 2024, Iowa market hogs have increased by 2.79%, adding around 670,000 to the market hog category. The decrease in sows farrowing and farrowing intention coincides with the trend that market hogs display. Iowa has seen a much larger decrease in sows farrowed (-4.17%) than the national change (-1.68%). However, farrowing intentions amongst Iowa hog producers has increased since last quarter (+4.39%) and last year (+5.56%). As the breeding herd decreases, typically it is from the culling of the least productive sows. Removing less productive animals from the herd increases the average productivity of the entire herd.
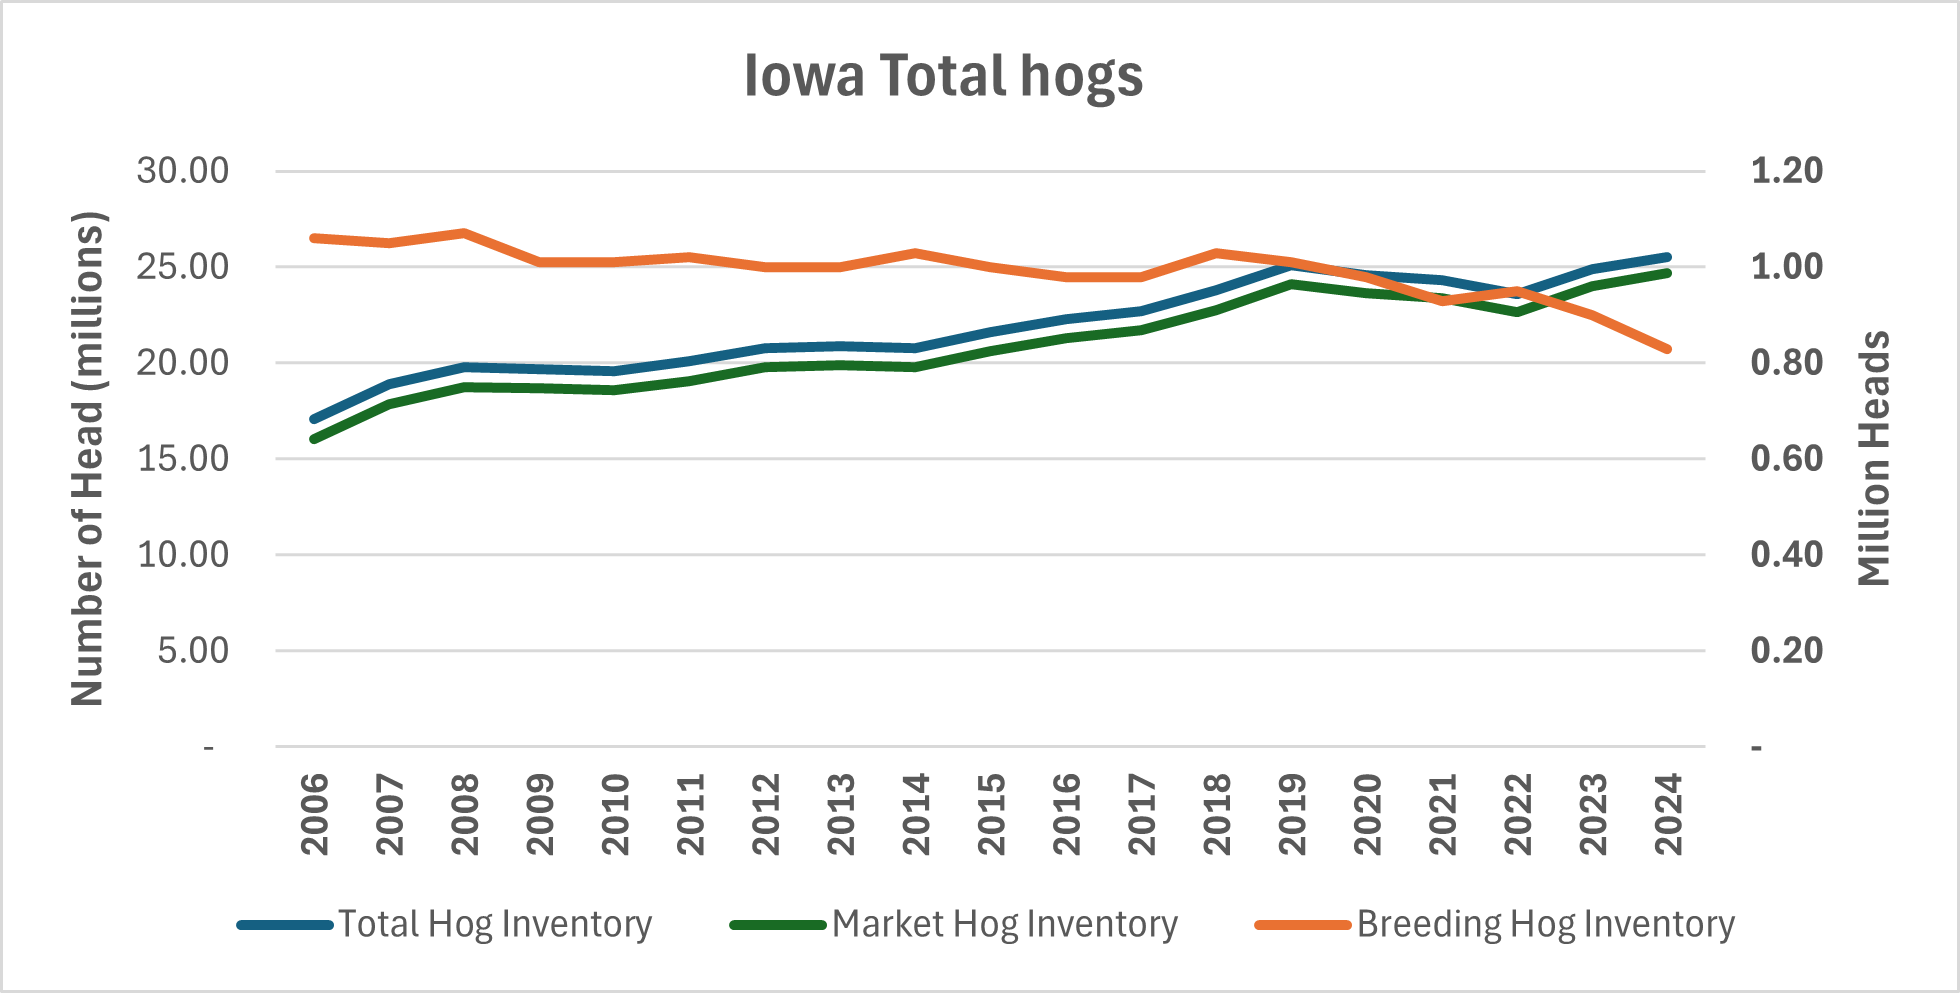
Figure 2. Iowa Total Hogs by June 1st
US market hog inventory slightly decreased for weight groups 0-119 lbs, but there has been a 3.48% increase in hogs weighing between 120-179 lbs. There was a 4.82% increase in hogs 180 lbs and over since last year (Figure 3). Iowa does not follow that trend as there has been an increase for every weight group compared to last year (Figure 4).
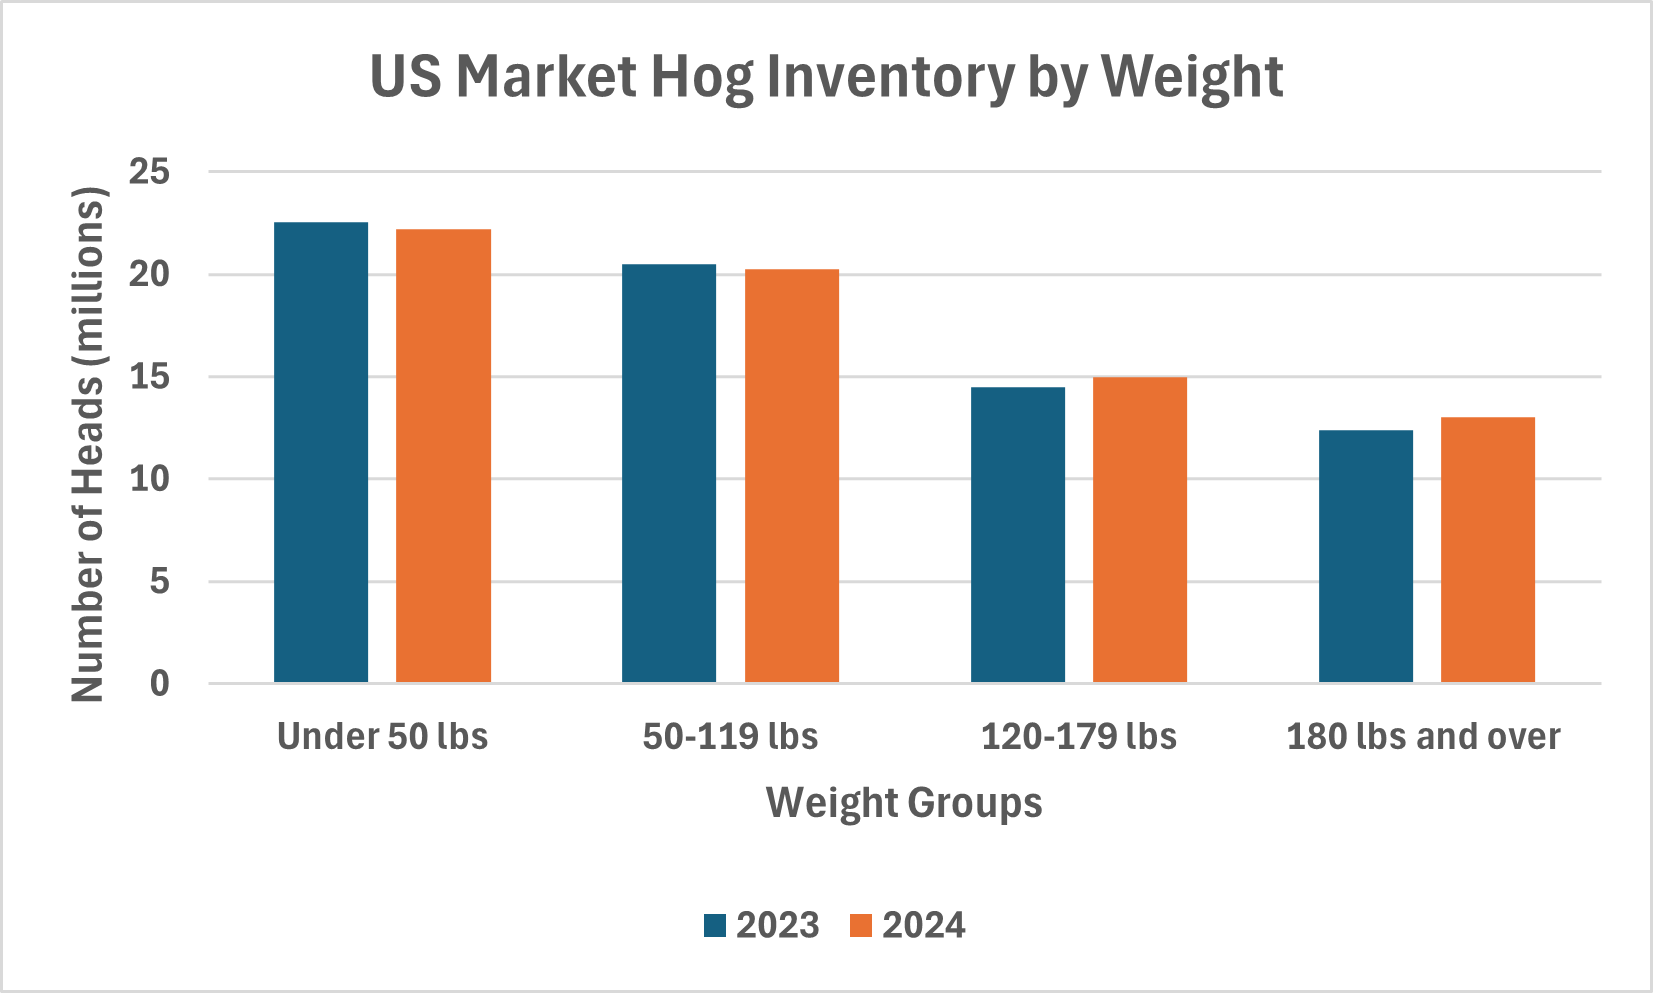
Figure 3. US Market Hog Inventory by Weight
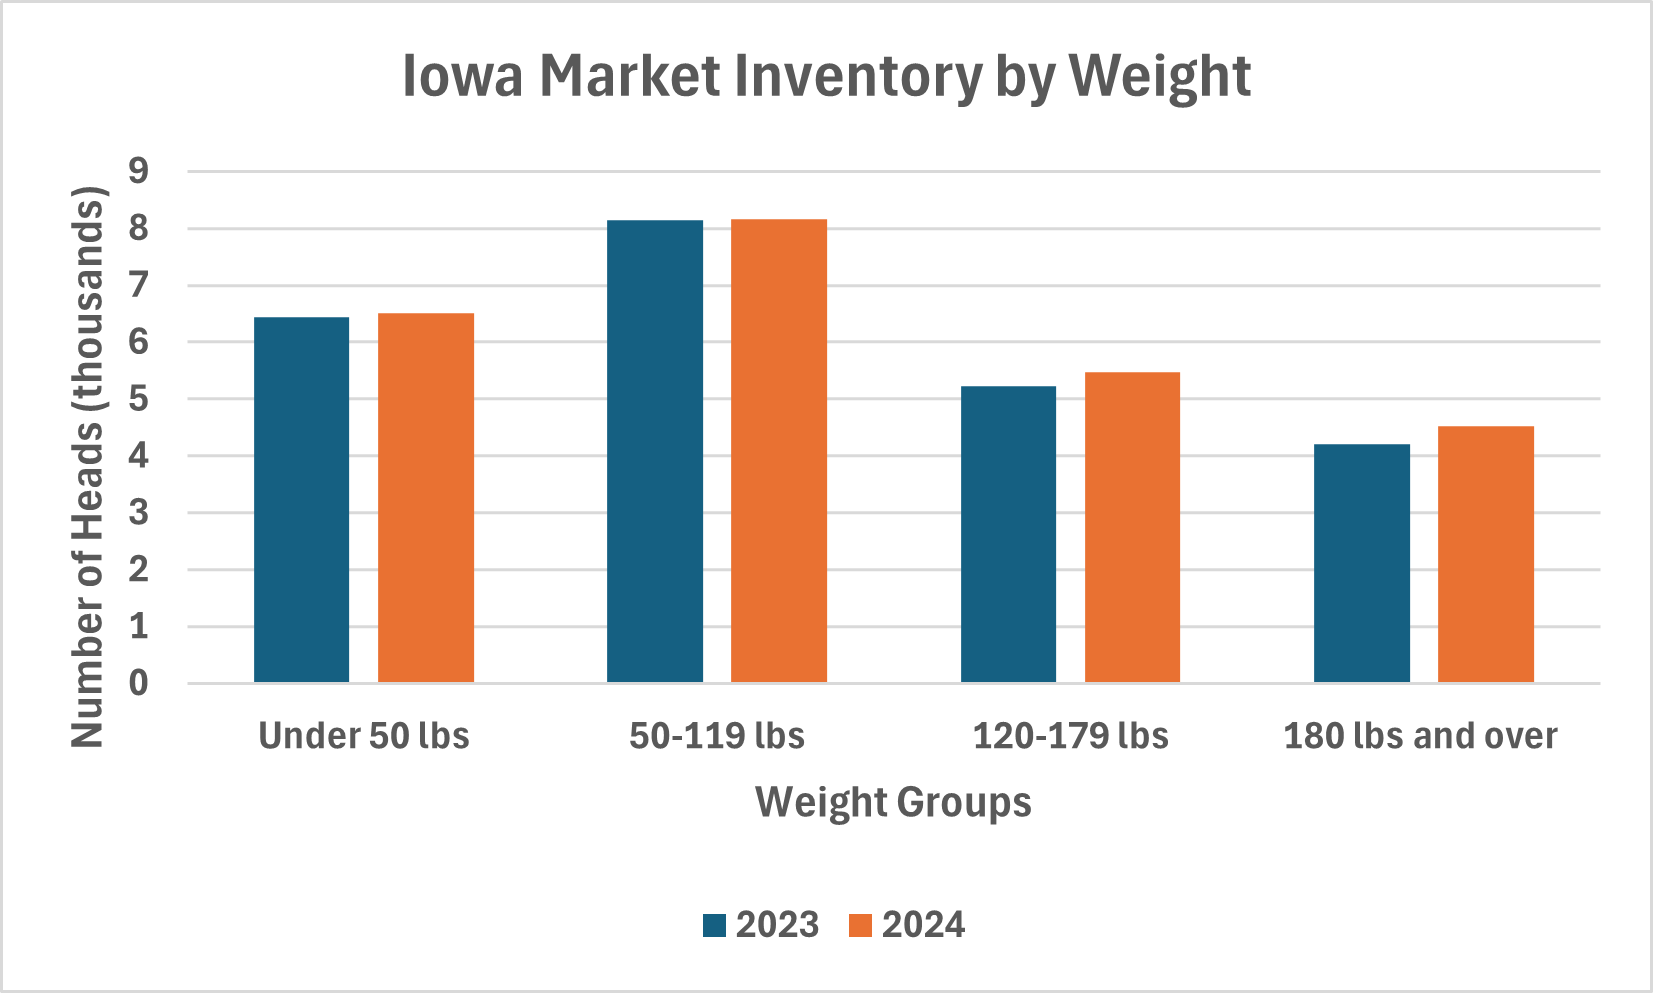
Figure 4. Iowa Market Hog Inventory by Weight
In Iowa, the number of sows farrowed has dropped off even more than nationally, thus the pig crop has also dropped somewhat even though the Iowa pigs per litter rate is above the national average. See Figures 5, 6 and 7. However as previously mentioned, Iowa’s farrowing intentions has increased by 4.40% since last year which does not follow the national trend.
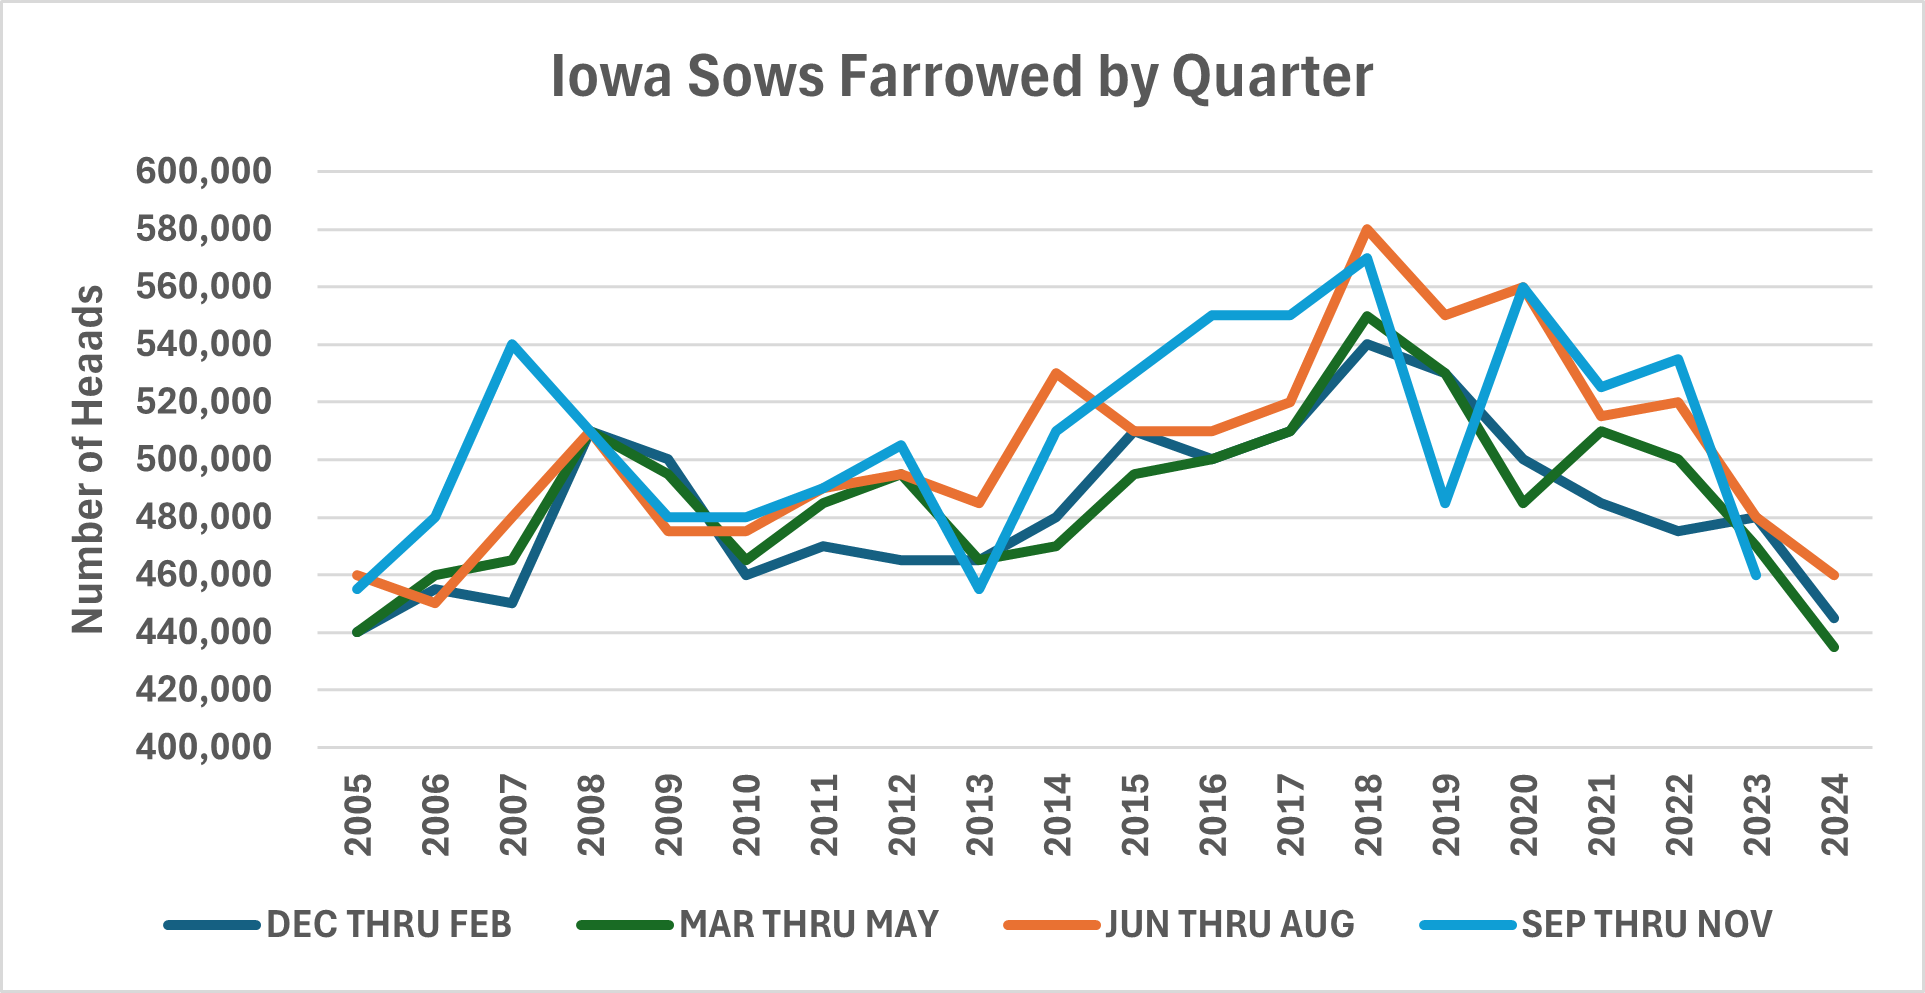
Figure 5. Iowa Sows Farrowed by Quarter
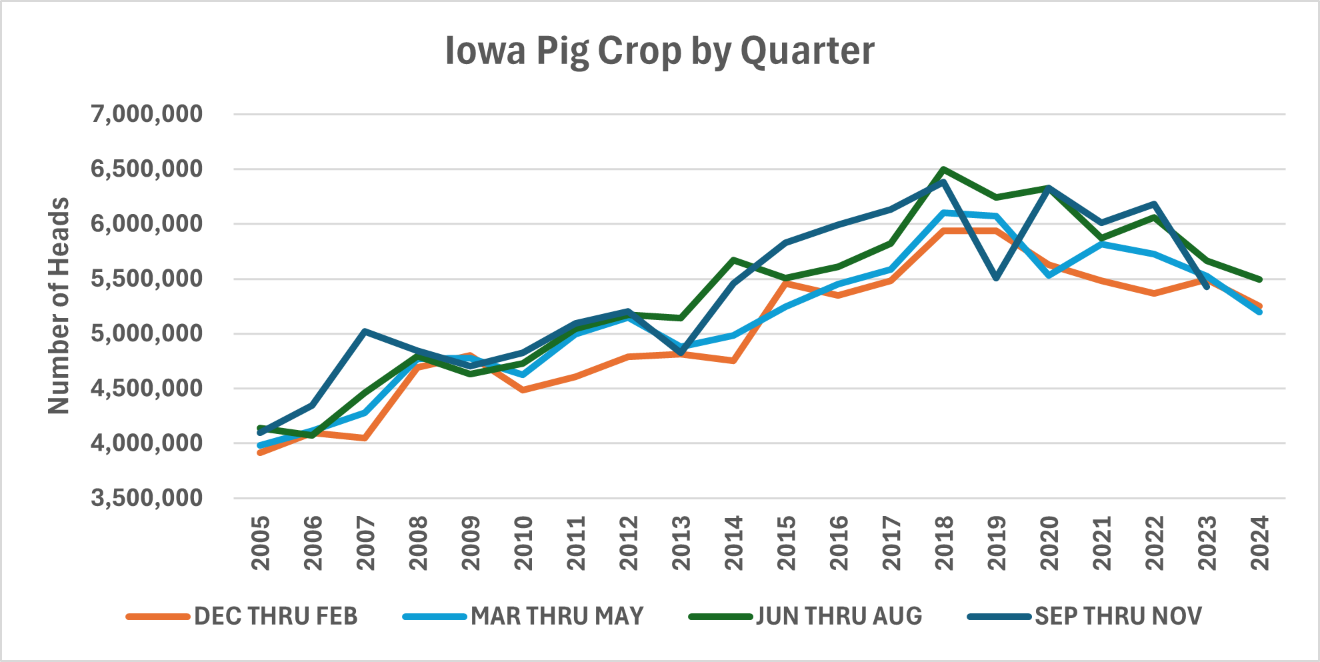
Figure 6. Iowa Pig Crop by Quarter
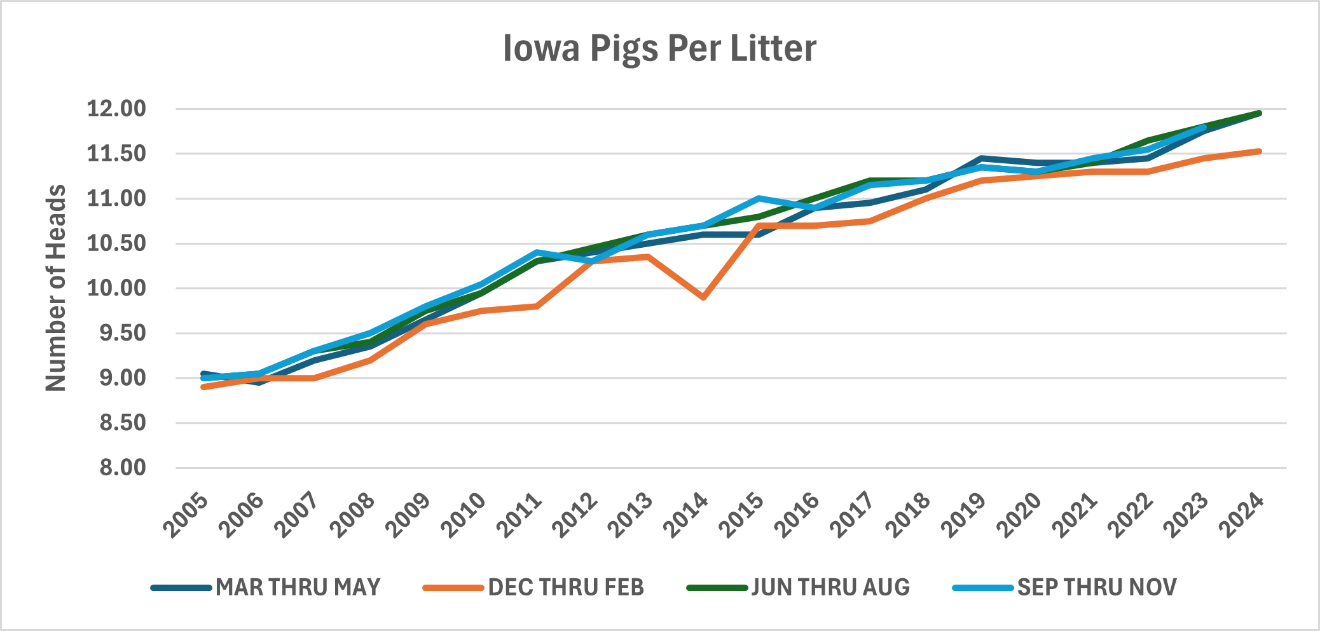
Figure 7. Iowa Pigs Per Litter by Quarter
The initial market reaction to the report was more choppiness in futures movement with a rise of about $1 per cwt, and then a fall of $2 per cwt with prices settling down $0.55 per cwt. Since then, the market has rallied one to two dollars per cwt.
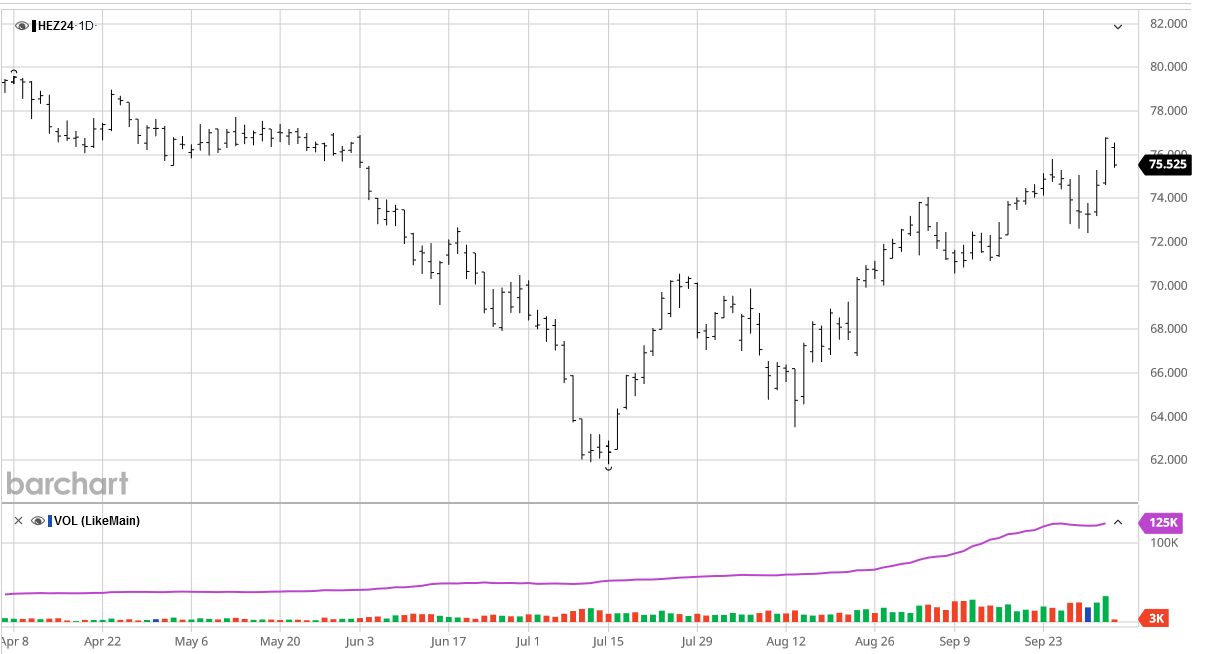
Figure 8. December 2024 Lean Hog Futures. Source: Barchart.com
Want more news on this topic? Farm Bureau members may subscribe for a free email news service, featuring the farm and rural topics that interest them most!