October 2024 WASDE Update
Author
Published
10/16/2024
The USDA released its updated WASDE report on October 11, 2024. The most intriguing aspect of the October WASDE are the yield and production estimates as farmers continue to harvest this year’s corn and soybean crop.
US corn ending stocks decreased by 52 million bushels and 58 million bushels respectively in the 2023/2024 and 2024/2025 marketing years. Soybean ending stocks increased by 2 million for the 2023/2024 marketing year and remained unchanged for the 2024/2025 marketing year. US wheat ending stocks decreased by 6 million bushels and 16 million bushels respectively in the 2023/2024 and 2024/2025 marketing years.
Table 1 shows some key report estimates along with trade analyst expectations.
Table 1. October 2024 USDA WASDE vs Market Expectations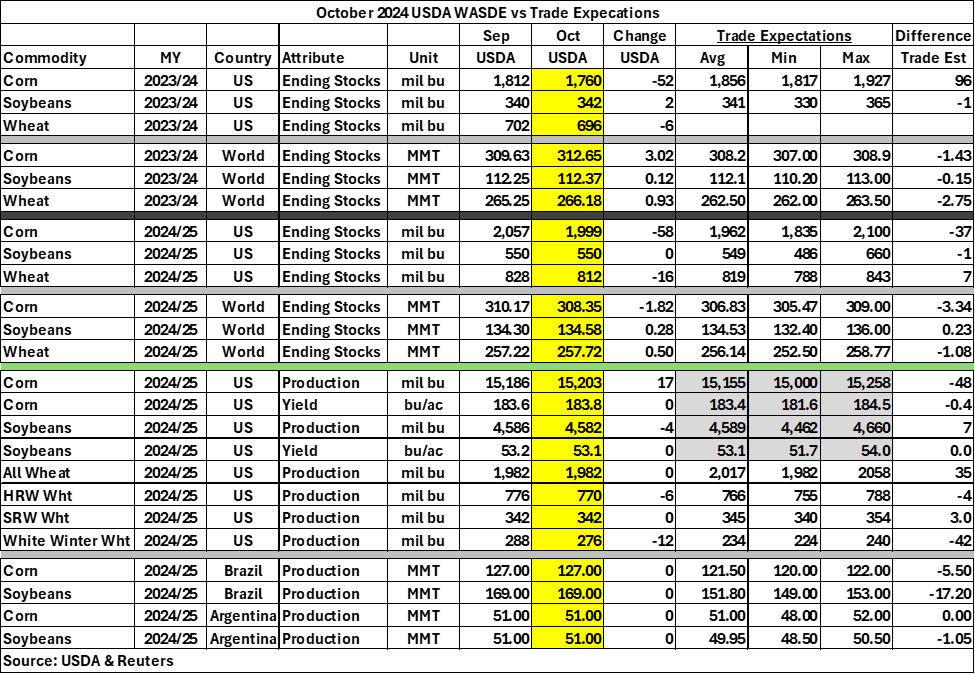
US corn production estimates increased by 17 million bushels in the 2024/2025 marketing year and yield per acre slightly increased by 0.2 bushels per acre. Soybean production and yield per acre estimates remained constant from September estimates in the 2024/2025 marketing year. Wheat production stayed constant from September to October for the 2024/2025 marketing year.
World corn, soybean, and wheat ending stocks increased slightly by 3.02. 0.12, and 0.93 MMT in the 2023/2024 marketing year. World corn ending stocks decreased by nearly 2 MMT in the 2024/2025 marketing year, while soybeans and wheat slightly increased by 0.28 and 0.50 MMT respectively in the 2024/2025 marketing year.
The USDA’s Brazil and Argentina corn and soybean production estimates remain unchanged from September to October.
Initial Market Reaction
The immediate market reaction to the USDA reports forced corn, soybean, and wheat prices to all decrease at 11:00 am CT. Corn prices decreased by 2 cents immediately after the release of the October WASDE. March corn prices initially began to steadily decline and finished the day almost 2 cents lower than when it opened. Soybeans prices immediately decreased by 5 cents and closed nearly 9 cents lower than the start of the day. Soybean futures contracts for January, March, and May followed a similar trend. Soybean meal prices decreased by 1 cent today and soybean oil decreased by less than 1 cent. Wheat prices decreased by 6 cents within 30 minutes of the WASDE releasing.
Changes to Domestic Balance Sheets
For corn, production decreased by 1 million bushels and imports decreased by 2 million bushels leading to a 3 million bushel decline in total supply. Total domestic increased by 61 million bushels, total use increased by 104 million bushels, and ending stocks decreased by 107 million bushels in the 2023/2024 marketing year. For the 2024/2025 marketing year, area planted and harvested stayed constant, while yields per acre increased by 0.7 bushels per acre. Beginning and ending stocks both decreased by 52 and 58 million bushels respectively. Production increased by 17 million bushels, total supply decreased by 33 million bushels, and total use increased by 25 million bushels due to an equal increase in exports. Expected average farm prices for 2023/24 decreased from $4.65 to $4.55, but is unchanged at $4.10 for 2024/25.
Table 2. October 2024 WASDE Corn Balance Sheet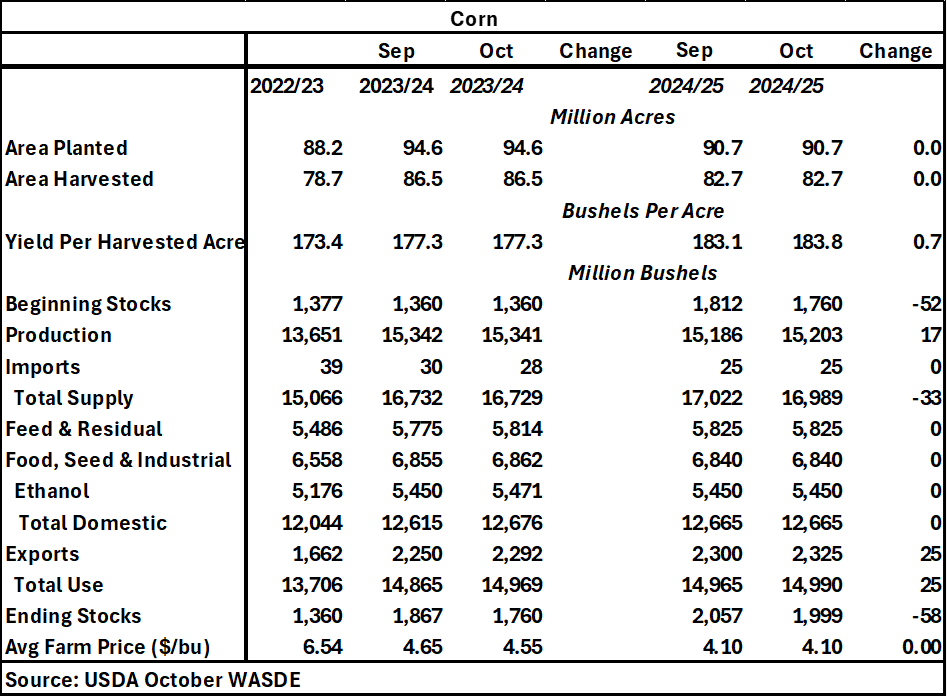
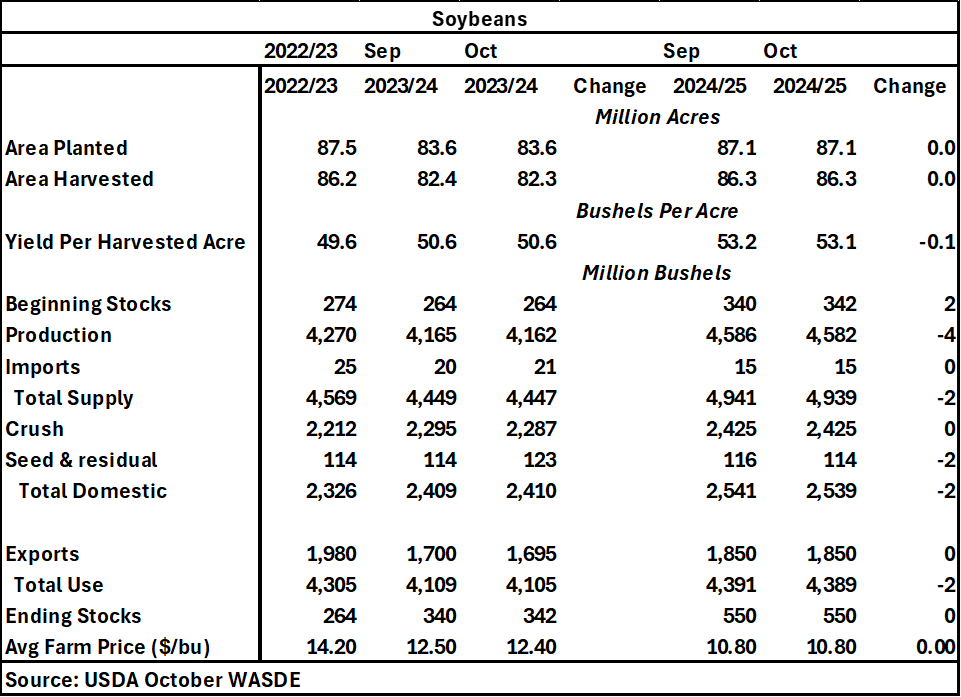
For soybeans, there was a minor change in the 2023/24 balance sheet with total supply decreasing by 2 million bushels, total domestic increasing by 1 million bushels, total use decreasing by 4 million bushels, and ending stocks increasing by 2 million bushels. For the 2024/25 marketing year, area planted and harvested remain unchanged, but yields per harvested acre decreased by 0.1 bushels per acre. Production decreased by 4 million bushels while total supply, domestic, and use all decreased by 2 million bushels. Ending stocks and average farm price remains constant from September to October.
Table 3. October 2024 WASDE Soybean Balance Sheet
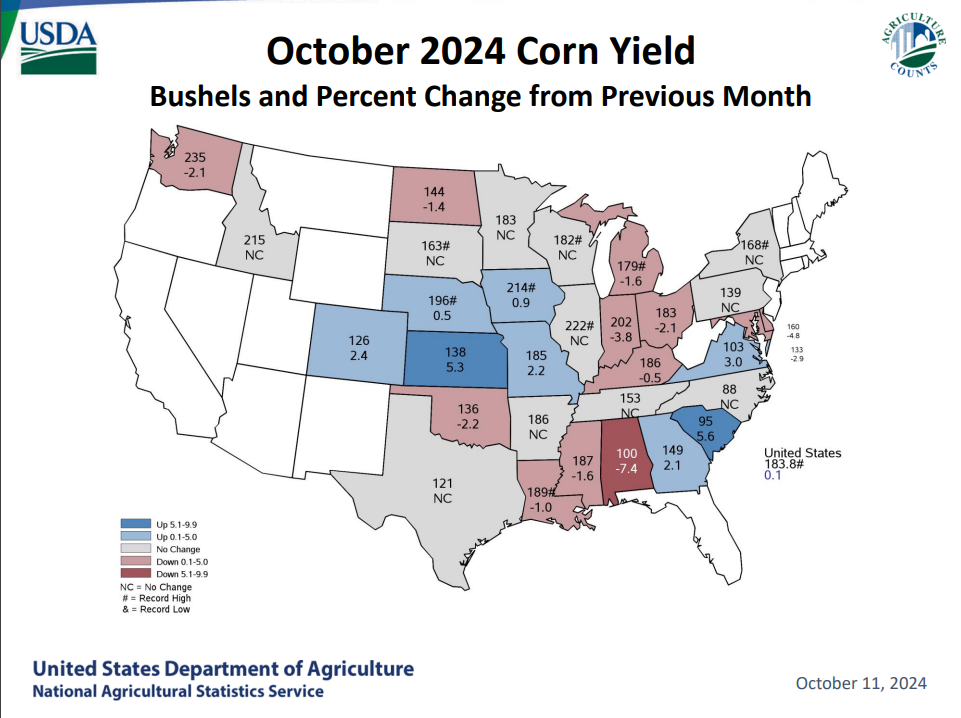
Corn and Soybean Yield Estimates
In aggregate the US corn yield forecast was increased from 183.1 bushels per acre to 183.8 bushels per acre. Changes to state yield estimates were mixed, especially across the corn belt. Iowa has an estimated 214 bushels per acre which is 0.9% increase from September. Kansas (138 bu/ac) experienced the highest percent change (+5.3%) in corn yield, followed by increases in Nebraska, Missouri, and Colorado. Indiana (202 bu/ac) had the largest percent decrease (-3.8%) in corn yield, with Ohio following close behind with an estimated 183 bushels per acre which is a 2.1% decrease from September.
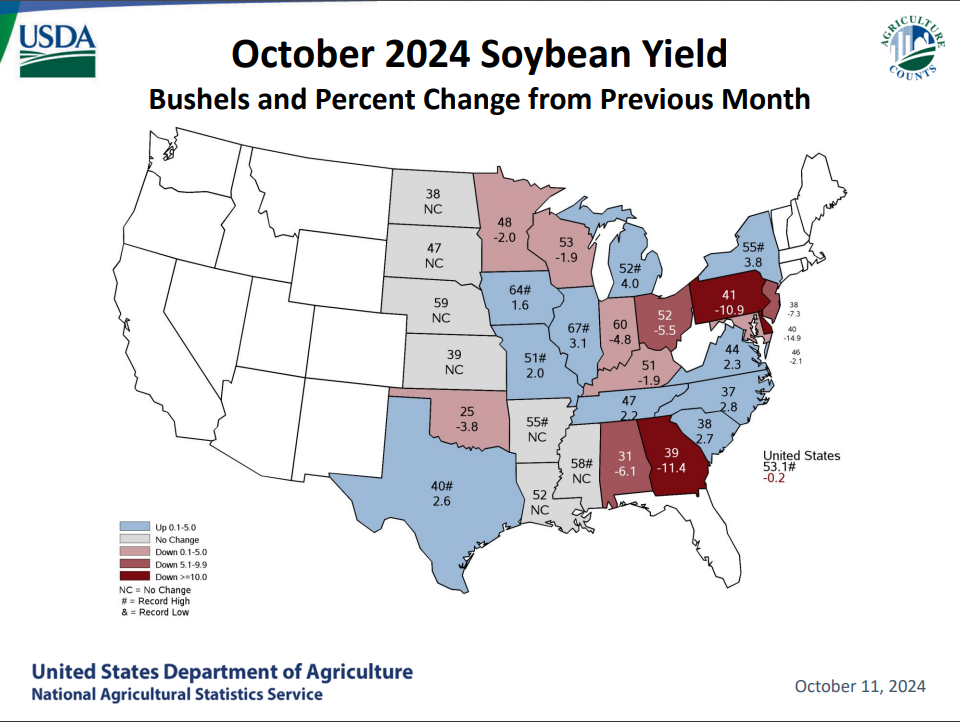
Soybean yield estimates decreased by -0.2% nationally, but Iowa enjoyed a 1.6% increase to 64 bushels per acre. Illinois and Missouri also experienced an increased percentage change in soybean yields. Indiana, Ohio, Wisconsin, and Missouri all showed a decrease in percentage change of soybean yields from September to October.
Want more news on this topic? Farm Bureau members may subscribe for a free email news service, featuring the farm and rural topics that interest them most!