July 2024 WASDE
Author
Published
7/15/2024
Introduction
The USDA released its updated WASDE report on July 12, 2024. This was the first WASDE report since the USDA acreage and USDA grain stocks reports released at the end of June. It was important to see the corn and soybean ending stocks following the USDA reports previously mentioned. Corn ending stocks in 2023/2024 marketing year decreased by 145 million bushels and were under trade expectations. Soybean ending stocks in the 2023/2024 marketing year slightly decreased by 5 million bushels. Wheat ending stocks in 2023/2024 marketing year increased by 14 million bushels. Corn exports increased by 75 million bushels in the U.S. supply and demand balance sheet. Soybeans only saw a minimal change for the 2024/2025 marketing year soybeans (production decreased 25 million bushels and ending stocks decreased 20 million bushels).
Table 1 shows some key report estimates along with trade analyst expectations.
Table 1. July 2024 USDA WASDE vs Market Expectations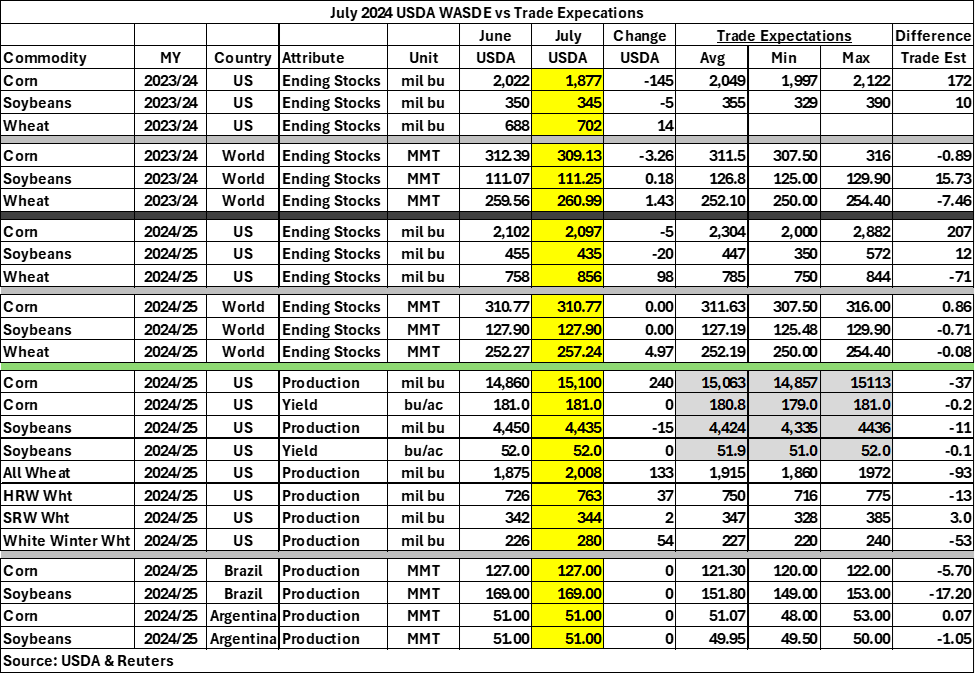
A large focus of this report was on the production estimates for Brazil and Argentina and potential changes on world ending stocks. USDA left 2024/25 corn production estimates unchanged from the June estimates for both Brazil and Argentina. Brazil’s CONAB estimated the 2023/24 Brazilian corn crop at 115.9 MMT still well below USDA’s estimate of 122 MMT. The USDA also kept 2024/25 soybean production constant for both Brazil and Argentina. Brazil’s 2023/24 soybean harvest has wrapped up and CONAB’s estimate of Brazilian soybeans is 147.337 MMT and this compares to USDA’s estimate of 153 MMT.
Initial Market Reaction
Going into the report, the corn market had drifted nearly 10 cents lower on the day, but immediately after the report was 3 to 5 cents higher on the day, a fairly strong, positive response to the report. But at the end of the day, corn closed 1 to 2 cents higher on the day.
The soybean market also reacted positively to the WASDE report rallying about 15 cents per bushel in the minutes after its release. But unlike corn, soybeans then drifted lower, losing most, if not all, of the gain that was seen immediately after the WASDE report. August soybeans closed down 12 cents per bushel and closed at the lowest level in the past 12 months. Soybean meal moved sideways right after the report but drifted lower towards the close. Soybean oil had an initial positive reaction to the report, but then lost all of that gain and ended up closing near the lows of the day, down about 50 cents per hundredweight.
Wheat ended more than 20 cents lower on the day and is back at the lows set in March.
Changes to Domestic Balance Sheets
This section summarizes changes to the corn and soybean balance sheets in more detail.
For corn, the changes in the 2023/2024 marketing year were exports increased by 75 million bushels, total domestic increased by 75 million bushels, and total use increased by 150 million bushels and ending stocks dropping by 145 million bushels to 1.877 billion bushels. For the 2024/2025 marketing year, production increased by 240 million bushels based on the increased acreage, total supply increased by 95 million bushels, and beginning stocks decreased by 145 million bushels. This all resulted in a 5 million bushel decrease in the 2024/25 corn ending stocks despite the increase in production. Expected average farm prices for 2023/24 was unchanged at $4.65 but decreases from $4.40 to $4.30 for 2024/25.
Table 2. July 2024 WASDE Corn Balance Sheet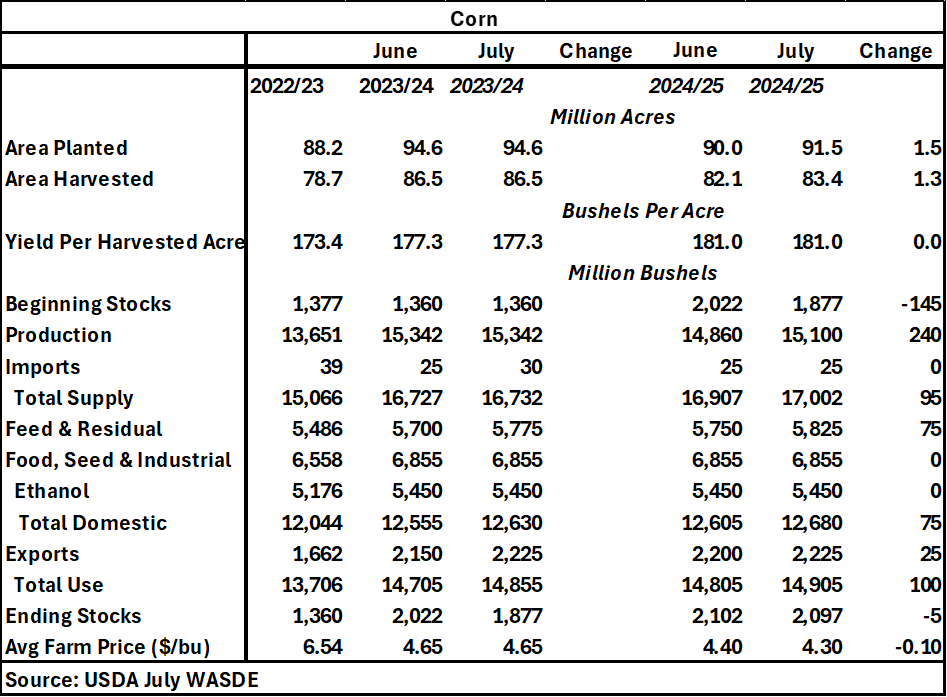
For soybeans, there was a minor change in the 2023/24 balance sheet with crush down 10 million bushels and ending stocks increased by 5 million bushels. For the 2024/25 marketing year, the change in acreage decreased the production by 15 million bushels, and this followed through with a 20 million bushel decrease in the 2024/25 ending stocks to 435 million bushels. Expected average farm prices for both 2023/24 and 2024/25 were unchanged at $12.55 and $11.20, respectively.
Table 3. July 2024 WASDE Soybean Balance Sheet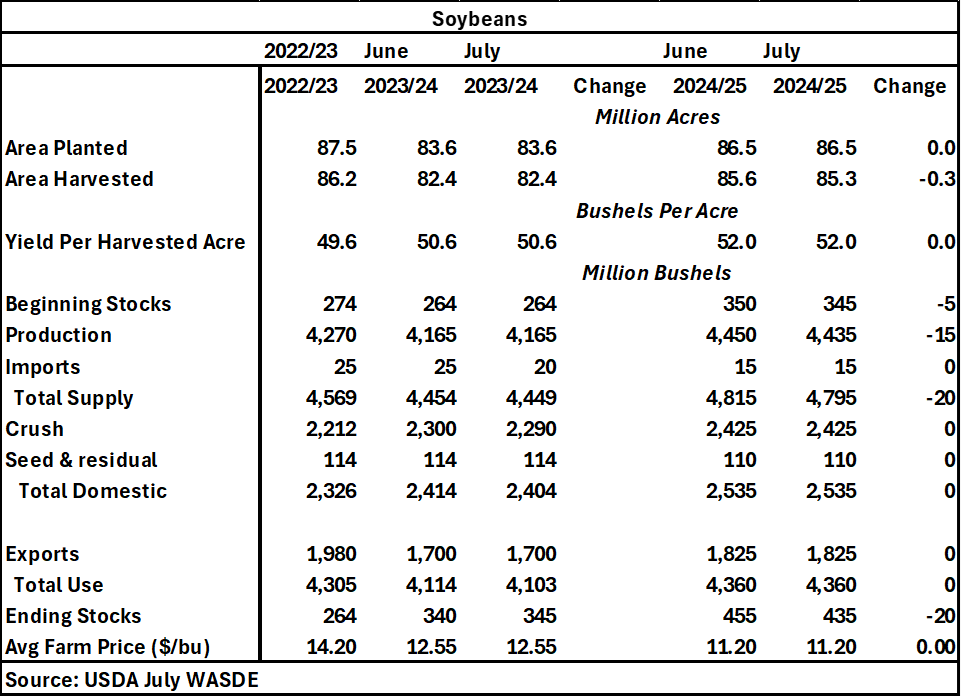
Want more news on this topic? Farm Bureau members may subscribe for a free email news service, featuring the farm and rural topics that interest them most!