Has Inflation Impacted U.S. Exports?
Author
Published
8/31/2022
The U.S. is a major agricultural producer and relies on international trade to market its products. The combination of the high inflation and a strong U.S. dollar have implications for foreign demand of U.S. goods.
Inflation is the rise of general price levels in an economy. When inflation occurs, it lowers the purchasing power of money, so the same amount of money can buy less things.
When the U.S. experiences high inflation, domestic demand for products, especially non-essential products, tends to fall as inflation lowers a consumer’s ability to purchase products. However, inflation in the U.S. does not always decrease the purchasing power of foreign consumers, because the price international trade partners pay for a product is also affected by the exchange rate. If U.S. prices increase but the dollar becomes weaker, or less expensive relative to other currencies, the price other countries must pay for U.S. products may not increase. However, if U.S. prices increase and the dollar becomes stronger relative to the currencies of purchasers of U.S. commodities due to central bank actions on interest rates and management of Treasury purchases, then the price foreign consumers must pay for U.S. products increases.
Besides increasing the price of products, inflation can impact also impact international trade through its relationship with real interest rates and exchange rates. The real interest rate is the interest rate minus the inflation rate within a country. Typically, countries with higher real interest rates (high interest relative to inflation) have higher valued currencies. That is the case currently unfolding as the U.S. dollar continues to strengthen against the Euro, the Yen and many other currencies.
Multiple indexes exist to measure the strength of the dollar relative to other currencies. The Real Broad U.S. dollar index is one measure (Figure 1). It is weighted so the currencies of countries who are larger trade partners with the U.S. have more weight in the index. The weights use total imports and exports and include all goods and services that are traded between countries. This index is also adjusted for inflation. The weights of major counties included in the index are given in Table 1. Increases in this index mean the dollar is becoming more valuable. Despite the high inflation in the U.S., the U.S. dollar index increased in 2021 and 2022. In Table 1, notice the dollar became stronger against the currencies of the top five countries in this index.

Figure 1. Real Broad U.S. Dollar Index
Table 1. Change in Real Broad U.S. Dollar Index and Real Exchange Rates of 5 Largest Trading Partners

Many factors could have contributed to the increase in the value of the U.S dollar. While the U.S. increased the supply of money in the economy during the COVID-19 pandemic, many other countries did as well. As a result, other countries are also experiencing inflation, many at higher rates than the U.S. Furthermore, the Russian invasion of Ukraine created a great deal of uncertainty in the international market. “Safe haven” currencies are currencies that are perceived to retain value, relative to the rest of the world, even in times of international market instability. The U.S. dollar is considered a “safe haven” currency and likely received strength from the uncertainty in the currency market. Finally, the U.S. Federal Reserve began raising interest rates in March 2022 and letting assets on the Federal Reserve’s balance sheet begin to roll off. Increases in the interest rate work to increase the real interest rate and provide support to the dollar’s strength.
Another way to measure the strength of the U.S. dollar is by using real commodity trade weighted indexes published by the USDA. These indexes are broken out for different commodities and weight currencies based on the total U.S. exports of certain commodities. For example, the corn index weights countries based on total corn imports received from the U.S. The trade of other products and services is ignored in these indexes. The USDA also creates indexes of competitor countries that also export large amounts of the commodities for comparison. Table 2 shows the percent change in the real commodity trade weighted indexes of major U.S. commodities from July 2021 to July 2022.
Table 2. Change in Real Commodity Trade Weighted Indexes (July 2021 - July 2022)

When comparing the U.S. to major U.S. competitors, higher percentages (highlighted in orange), means that group’s currency (U.S. or competitors) became stronger against the currencies of major importers. Simply put, a higher percentage means that group became less competitive selling that commodity due to changes in exchange rates. Th U.S. became relatively less competitive selling corn, soybeans, beef, and pork as all have become more expensive relative to major competitors in the last year due to changes in exchange rates.
Differences in the U.S. indexes exist between commodities because the destination of U.S. exports varies by commodity. Table 3 shows the weights of corn and soybeans, which saw increases of 4.4% and 5.1%, respectively, and dairy, which saw only a 3.7% increase. Notice the U.S. dollar appreciated more against major importers of U.S. corn and U.S. soybeans as opposed to U.S. dairy products.
Table 3. Weights of Corn, Soybeans, and Dairy in Real Commodity Trade Weighted Indexes for U.S. Exports and Changes in Real Exchange Rates

Both the broad dollar index and the commodity trade-weighted indexes illustrate the dollar has gained strength. A strong U.S. dollar typically decreases foreign demand for U.S. goods, as the same amount of foreign currency buys less U.S. goods. In addition to the dollar’s strength, commodity prices within the U.S. have also risen, in part due to inflation. These two factors are both expected to reduce foreign demand for U.S. commodities. However, production problems due to drought and other factors have reduced supplies in many other countries and in some cases, commodity prices within those countries have risen even more than U.S. commodity prices.
Increases in U.S. prices and a strong U.S. dollar have reduced U.S. exports from the records set last year. Corn and soybeans exports in recent years are shown in Figures 2 & 3. Exports are shown based on USDA marketing years, which run from September 1 to August 31 for corn and soybeans. The light blue lines represent exports for the most recent 2021-2022 marketing year, which ends on August 3, 2022.
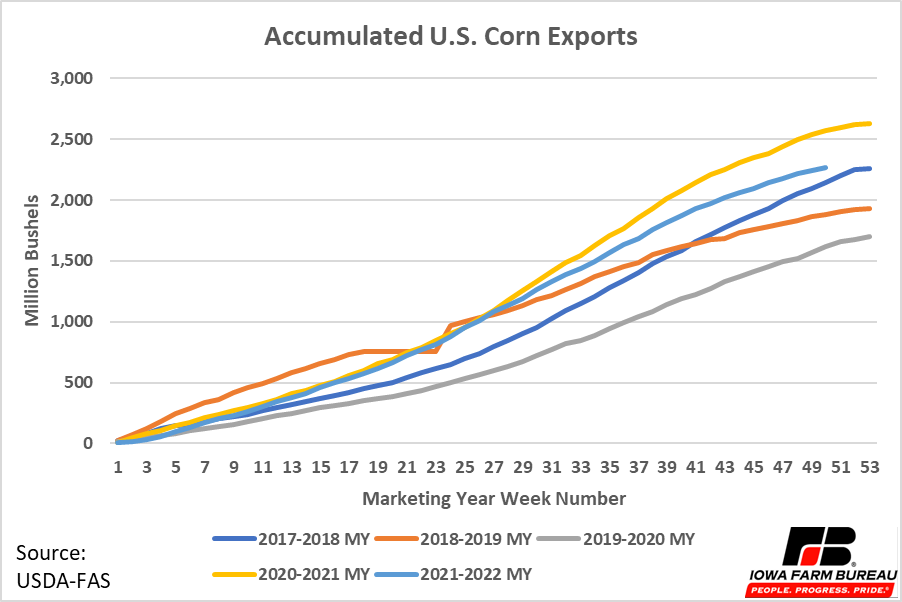
Figure 2. U.S. Corn Exports (Million Bushels)
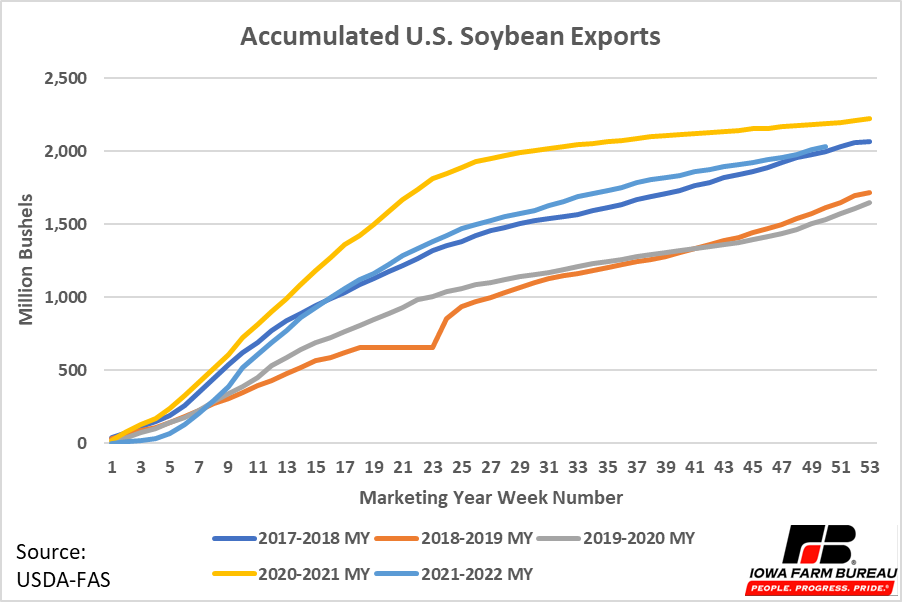
Figure 3. U.S. Soybean Exports (Million Bushels)
While exports have decreased from last year, they have remained in line with exports of recent years for both corn and soybeans. More importantly though, is how U.S. exports compare to world exports. Table 4 shows the difference in exports of corn and soybeans by major exporters between the 2020-21 marketing year and 2021-22 marketing year. Notice the U.S. saw reduced corn exports during this period, while other major exporters, primarily Brazil, saw an increase. Brazil did have lower than usual exports in 2020-21, around 825 million bushels, compared to annual exports of over 1,500 million bushels in 2018-19 and over 1300 million bushels in 2019-20. This was in part due to lower than usual production in the 2020-21 marketing year, which would have reduced Brazil’s supply of corn and increased its price. Both the strength of the dollar and the increased supply of Brazil’s crop have likely made Brazil more competitive in the export market this year.
While some major exporters saw growth in corn exports between the 2020-21 and 2021-22 marketing years, no major soybean exporters identified in the WASDE report saw growth in soybean exports. The U.S. did not see reductions as large as some other countries, notably Argentina and Paraguay, but the reduction in their exports was at least in part caused by reduced production. Because other major soybean exporters had reduced production this past year, it is difficult to identify the effects of inflation and the dollar’s strength on U.S. soybean exports. The reduced supply of soybeans in countries like Argentina and Paraguay likely have offset potential losses to U.S. soybean exports from inflation and the strength of the dollar.
Table 4. Change in Production and Exports of Major Exporting Countries (2020-21 Marketing year to 2021-22 Marketing Year)

As shown in the examples above, the effect of inflation and the exchange rate on U.S. exports can be hard to determine because other factors also influence trade and could be pushing trade in opposite directions. For example, in the soybean market, the strength of the dollar and U.S. inflation suggest U.S. exports should decrease, while reduced soybean supply in other countries suggests U.S. exports should increase.
Economic research has attempted to identify the reaction of U.S. exports to both increases in prices and the appreciation of the U.S. dollar, while holding all other factors equal. With regards to increases in the exchange rate, Shane et. al. (2008) estimated a 1% appreciation of the dollar leads to 0.5% decrease into agricultural exports. The reported reaction for corn was large, a 1.3% decrease for a 1% appreciation of the dollar, while the reported reaction for soybeans was smaller, a 0.19 decrease for a 1% appreciation of the dollar. The effect of increases in U.S. crop prices (inflation) on U.S. exports has also been examined. Reimer et. al. (2012) found a 1% increase in the price of U.S. corn led to a 1.64% decrease in foreign demand in the long run, and a 1% increase in the price of U.S. soybeans led to a 1.45% decrease in foreign demand in the long run.
All else equal, the increase of U.S. commodity prices and the strengthening of the dollar are expected to reduce exports. However, other factors also affect U.S. trade, so changes to U.S. dollar exchange rates are not always obvious in export numbers. For example, other factors like market instability or reduced foreign supply could offset some or all the effects of a stronger dollar and inflation and increase foreign demand for U.S. products. It is possible that had the increase in market prices and the exchange rate not occurred, exports of U.S. agricultural products would have been higher this past year.
References:
[1] Shane, M., T. Roe, and A. Somwaru. 2008. “Exchange Rates, Foreign Income, and U.S. Agricultural
Exports.” Agricultural and Resource Economics Review 37(2): 160-175.
[2] Reimer, J.J., X. Zheng, and M.J. Gehlhar. 2012. “Export Demand Elasticity Estimation for Major U.S.
Crops.” Journal of Agriculture and Applied Economics 44(4): 501-515.
Economic analysis provided by Aaron Gerdts, Research Analyst, Decision Innovation Solutions on behalf of Iowa Farm Bureau.
Want more news on this topic? Farm Bureau members may subscribe for a free email news service, featuring the farm and rural topics that interest them most!