Ethanol Production, Corn Usage, Prices, and Exports
Author
Published
4/2/2025
U.S. and Iowa Ethanol Production
The ethanol industry contributes to the U.S. and Iowa’s economy. Figure 1 shows the substantial expansion in ethanol production since 1981, with different events that have affected the industry, particularly the Renewable Fuel Standard (RFS I (2005) and RFS II (2007)) policy. The industry expanded sharply in the mid-2000s and has continued increasing since 2013.
Since Iowa is top producer, ethanol production in the state has followed the national trend. By 1985 Iowa production was at 67.6 million gallons, but by 1990, Iowa was producing 212.5 million gallons (28%) of U.S. ethanol production. Growth in ethanol production continued for the next 14 years but it was not until 2005 that ethanol production in Iowa surpassed 1 billion gallons.
The latest EIA data indicates that the U.S. production of ethanol in 2024 reached a record of 16.22 billion gallons, up 4% (639 million gallons) from the previous year. Meanwhile, Iowa ethanol production kept a steady pace at 4.6 billion gallons with a share of the national production of 28%, down from 30% in 2023.
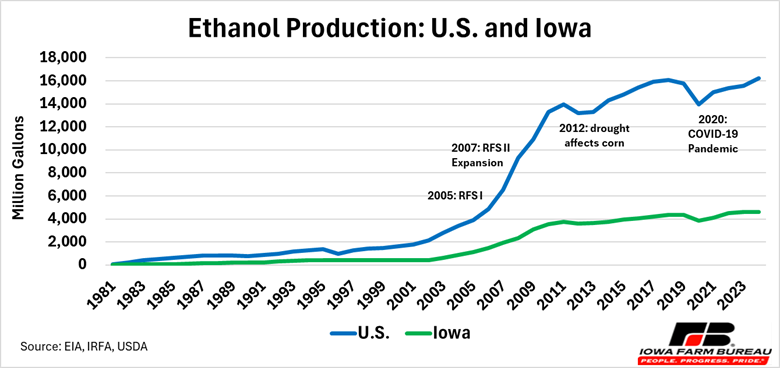
Figure 1. Ethanol Production: U.S. and Iowa
Iowa Corn for Ethanol Usage
Figure 2 shows Iowa ethanol production and the amount of corn used by the industry from 1981 to 2024. With the expansion of production, ethanol has become an important source of demand for corn in the US and especially in Iowa. The state corn use in ethanol production was estimated at 170.87 million in 2000, which was about 10% of Iowa’s corn production, compared with 1.56 billion in 2024, which was about 59% of the state corn production that year.
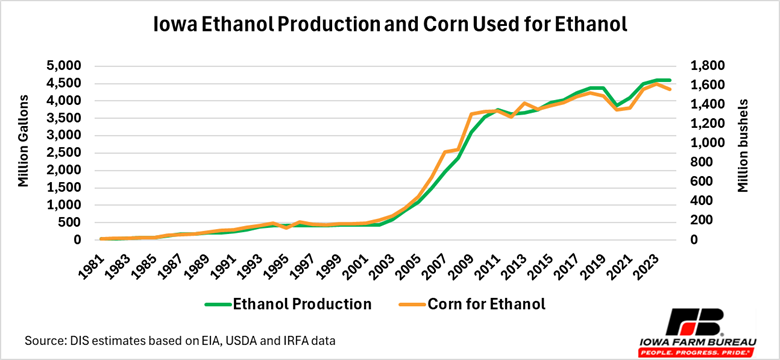
Figure 2. Iowa Ethanol Production and Corn Used for Ethanol
Iowa Ethanol Price and Cost of Major Ingredients
Figure 3 shows Iowa monthly average price of ethanol and cost of inputs. Iowa average ethanol price varied between $1.43/gallon (Feb and Mar) to $1.86/gallon (Jun) during 2024, for an annual average of $1.60/gallon, which was down 25.7% from the average price in 2023 ($2.15/gallon). Ethanol price is estimated as the sum of per-gallon returns over operating costs plus net cost of corn (corn cost less distillers grain value[1]) and other operating costs (including the cost of natural gas). Note that positive operating returns do not always imply profits as other costs such as plant financing and returns to capital still must be considered.
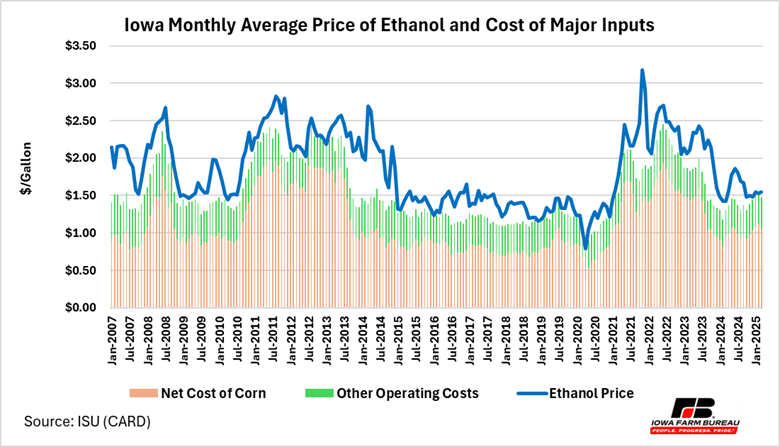
Figure 3. Iowa Monthly Average Price of Ethanol and Cost of Major Inputs
U.S. Ethanol Exports
Despite varying, U.S. ethanol exports have followed a substantial upward trend. The U.S. exported 36.87 million gallons of ethanol in 2006 compared with a record high volume of 1.913 billion in 2024, for an estimated increase of 5,091% between 2006 and 2024. In 2006, the U.S. exported 0.8% of the total ethanol production (4.88 billion gallons) compared with 11.8% of the 2024 production (16.2 billion gallons) (see Figure 4).
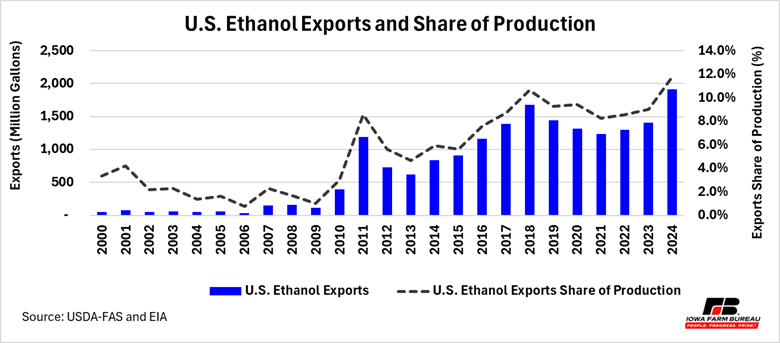
Figure 4. U.S. Ethanol Exports and Share of Production
U.S. ethanol exports in 2024 (1.91 billion gallons) increased by 510.6 million gallons compared with the 2023, indicating that most of the growth in ethanol production in 2024 was consumed in overseas markets.
With U.S. ethanol production and exports increase, the number of U.S. ethanol importing countries has grown from 58 in 2000 to 81 in 2024. Canada has been a steady and growing large market for U.S. ethanol (see Figure 3). Export to Canada expanded from 9.65 million gallons in 2002 to 674.59 million gallons in 2024. Since 2020, Canada has been the top market for U.S. ethanol.
U.S. ethanol shipments to Brazil have substantially declined. A relatively large tariff imposed on U.S. ethanol is making it significantly less competitive relative to Brazil’s own sugarcane-based ethanol production. Brazil imposed a tariff on U.S. ethanol in 2017 and temporarily eliminated it from March 2022 to the end of that year[2]. The tariff was removed during that period to help moderate rising gasoline prices. In October 2024, Brazil’s Foreign Trade Chamber rejected the request made by the Brazilian Association of Fuel Importers (ABICOM) and the U.S. Grain Council to remove the 18% tariff on ethanol imports to Brazil[3].
Other markets that have increased their imports of U.S. ethanol include India, the Netherlands, the United Kingdom, The Philippines, and Mexico.
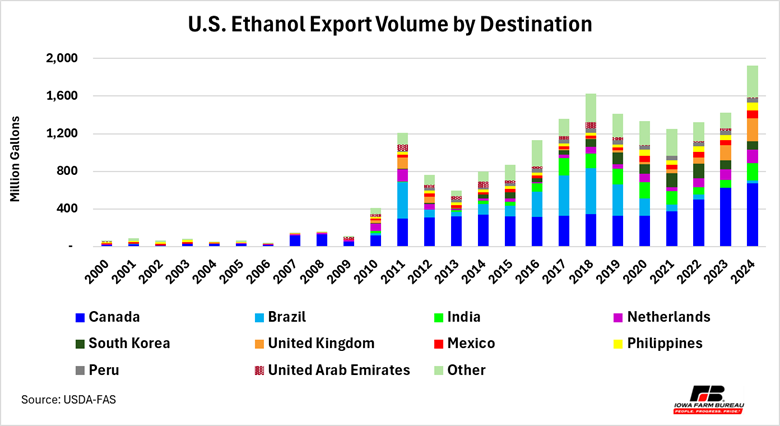
Figure 5. U.S. Export Volume by Destination
[1] Since November 2016 distillers corn oil, a co-product of ethanol production, is part of the calculations.
Want more news on this topic? Farm Bureau members may subscribe for a free email news service, featuring the farm and rural topics that interest them most!