Corn acreage comes in higher than trade expectations
Author
Published
7/1/2024
The June 28 USDA Crop Planting Report indicates that Iowa will plant 13.1 million acres of corn and 9.9 million acres of soybeans. Corn acres remain constant from a year ago, while soybean acres have a slight decrease of -0.5% from a year ago. Nationally, USDA reports that farmers have planted 91.5 million acres of corn, a drop of 3.6% from a year ago, and 86.1 million acres of soybeans, an increase of 3% from last year. Iowa corn acreage has decreased by -3.7% over the past decade. Iowa soybean acreage has increased by 0.5% over the past decade (Figure 1).
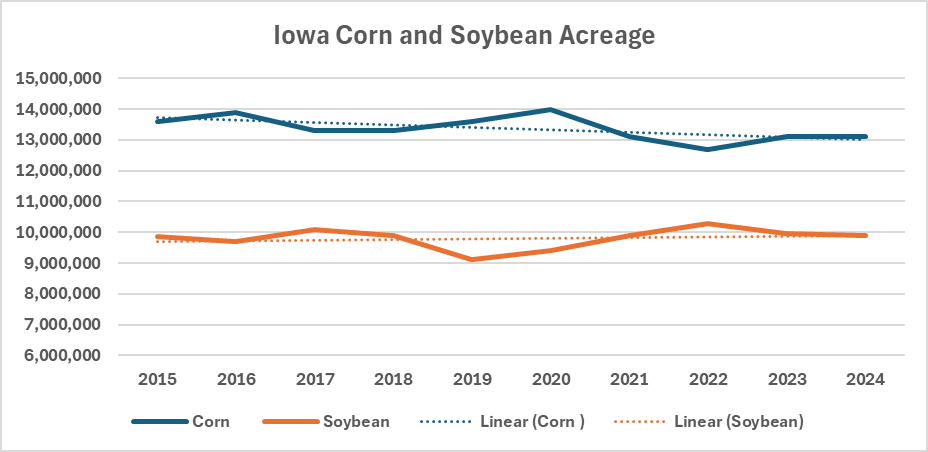
Figure 1. Iowa Corn and Soybean Acreage
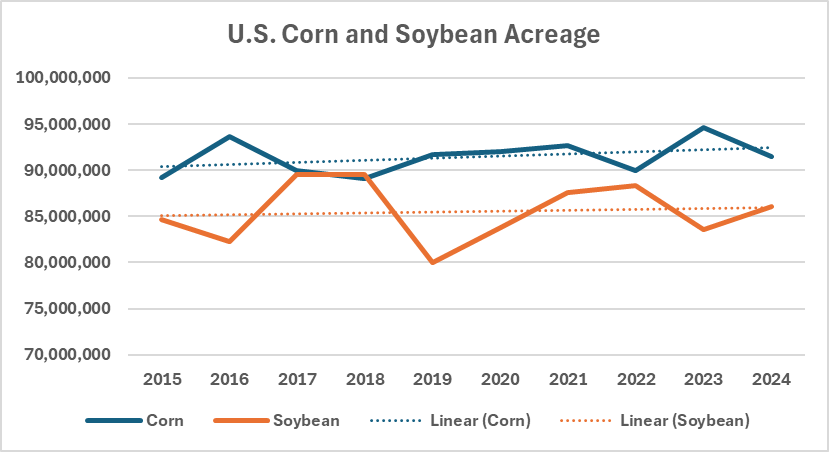
Figure 2. U.S. Corn and Soybean Acreage
U.S. corn acreage has increased by 2.6% overall since 2015. However, corn acreage has decreased by -2.8% since last year. U.S. soybean acreage increased by 3% since last year (Figure 2). Figure 3 shows the 2024 corn planted acres and the percentage change from 2023.
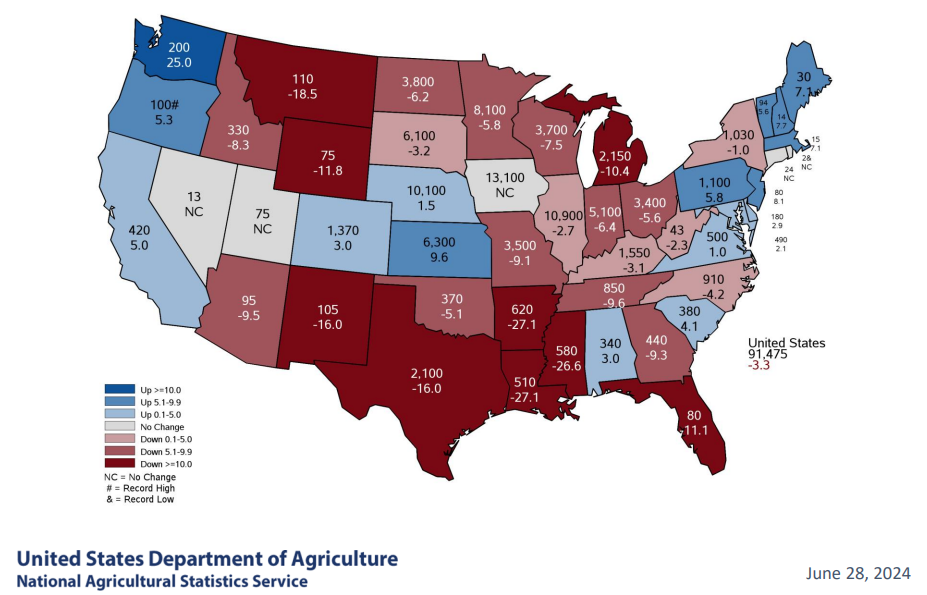
Figure 3. 2024 Corn Planted Acreage (1,000 Acres) and Percent Change from Previous Year
Figure 4 shows the 2024 soybean planted acreage along with the percent change from 2023. Most of the Midwest is seeing a modest increase in soybean acres planted. Iowa’s soybean acres are down 0.5%, whereas soybean acres in Illinois and Minnesota are up 3.4%, Wisconsin up 1.9%, Nebraska up 1% with South Dakota and Missouri unchanged.
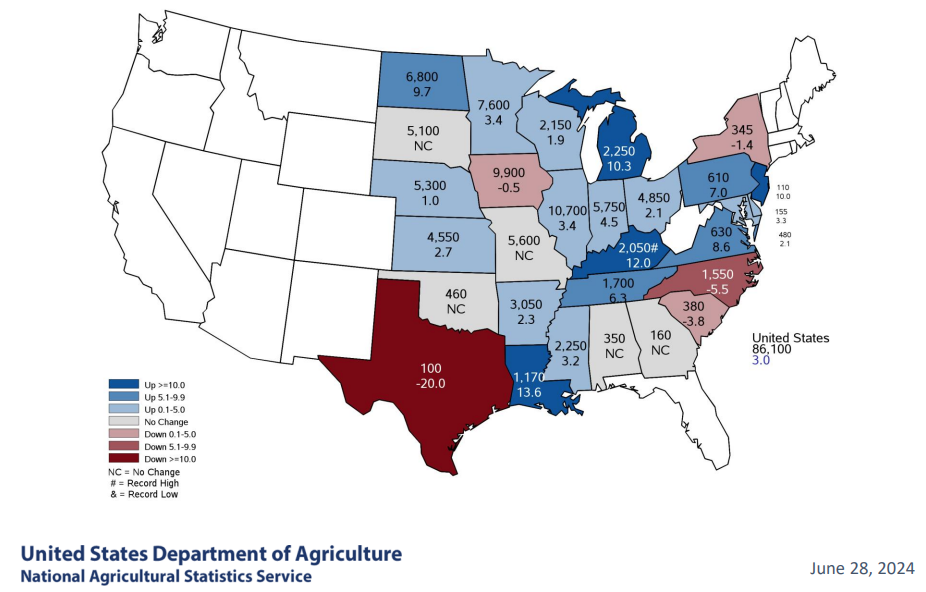
Figure 4. 2024 Soybean Planted Acres (1,000 acres) and Percentage Change from Previous Year
Historically, the June crop acreage report has been a fairly accurate predictor of actual crop acreage for corn and soybeans in Iowa. Over the past few years, the June acreage number for Iowa corn has been between 96-99% of final corn acreage. In recent years, corn acres harvested for grain have been between 93% and 96% of the June acreage number with the lowest year being 2020 when a large swath of Iowa was affected by the derecho.
In recent years, Iowa’s final soybean acreage has been 101% to 102% of that reported in the June crop report. Harvested soybean acres in Iowa have fluctuated between 99% of the June acreage number and 101% of the June soybean acreage number.
For the U.S., the June corn crop acreage has been between 97% and 101% of final acreage. In 2023, the June corn crop acreage was 99% of the final acreage. Corn acreage harvested for grain in the U.S. averages 90% of the June corn acreage number with the recent low being 89%. Most of the difference between planted corn acres and harvested corn acres is corn that is harvested for corn silage.
Nationally, soybean harvested acreage has averaged 103% of the June soybean acreage number with the low being 99% of the June number and the high being 107% of the June number. In years when plantings are delayed, the final harvested acreage of soybeans tends to have the largest upward adjustments from the reported June soybean acreage figures.
Market Reaction
The initial market reaction to the combination of planted acreage and quarterly grain stocks was very negative for corn and slightly friendly for soybeans. Corn dropped more than 20 cents per bushel in the first few minutes after the release of the reports. Soybeans actually rallied about a dime before being dragged lower by the negative actions in the corn and wheat markets. Nearby corn closed down 16 cents, new-crop corn down 13 cents, nearby soybeans down 1 to 2 cents and further deferred soybean prices actually closed up. Soybean meal was down. Soybean oil closed higher.
Figure 5 shows the planted acreage for corn for the continental U.S. and the state-by-state change from the March intentions. Planted acres of corn in most of the western corn belt was higher than the March intentions. This contributed to the decline in corn price.
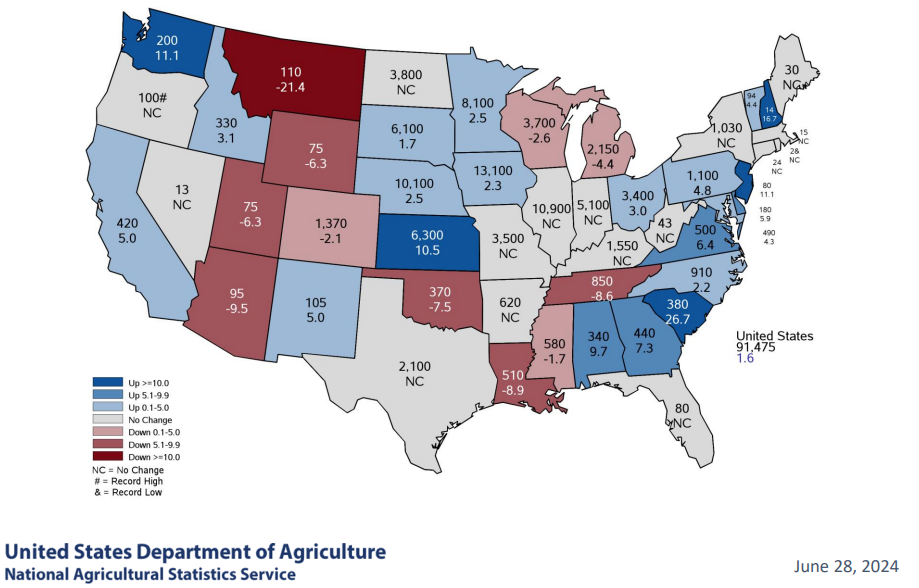
Figure 5. Map of 2024 Corn Planted Acreage (1,000 acres) and Percent Change from Previous Estimate
Soybean planted acres were much more mixed when compared to the March Planting Intentions report. Iowa planted 2.9% less acres than the March intentions, but Minnesota planted 1.3% more than the March intentions. Some of the largest deviations from March Soybean planting intentions were seen in Oklahoma (-16.4%), Missouri (-6.7%), and North Carolina (-6.1%). The biggest gainers of soybean acreage compared to the March intentions were Alabama (+9.4%), South Carolina (+8.6%), Kansas (+7.1%), and Kentucky (+5.1%).
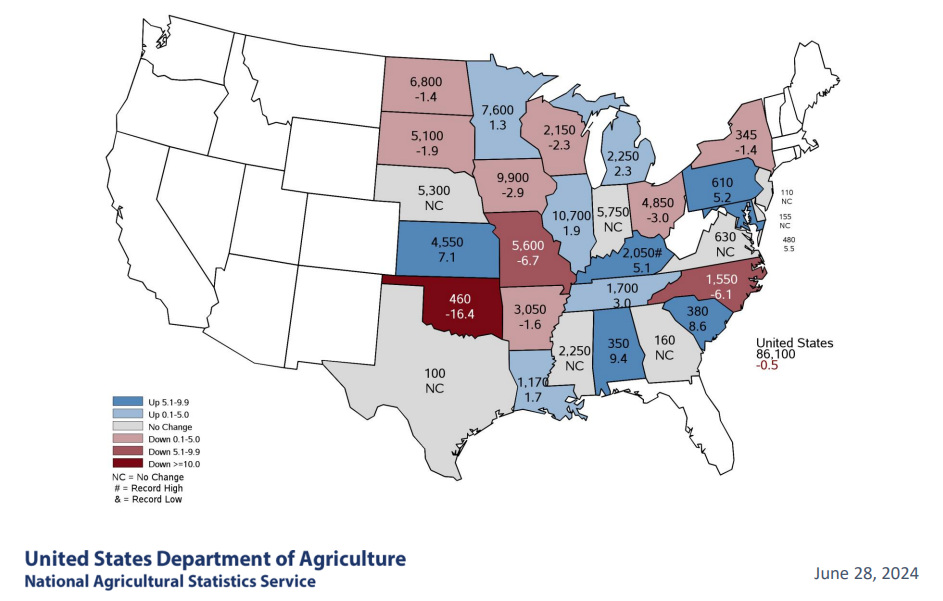
Figure 6. 2024 Soybean Planted Acres (1,000 acres) and Percentage Change from the Previous Estimate
Want more news on this topic? Farm Bureau members may subscribe for a free email news service, featuring the farm and rural topics that interest them most!