2023 US Prospective Planting Report Recap
Author
Published
4/4/2023
The USDA released their first acreage estimates on Friday, March 31. US planted corn acreage is projected to be 92.0 million acres, up 3.9% compared to last year (Figure 1). US soybean acreage is projected to be 87.5 million acres, up 0.1% from last year.
While not shown in Figure 1, US wheat acreage is projected to be 49.9 million acres, up 9% from last year. Total field crop acreage of these 3 major crops and other field crops is projected to be 318.1 million acres, up 1.9% compared to last year.
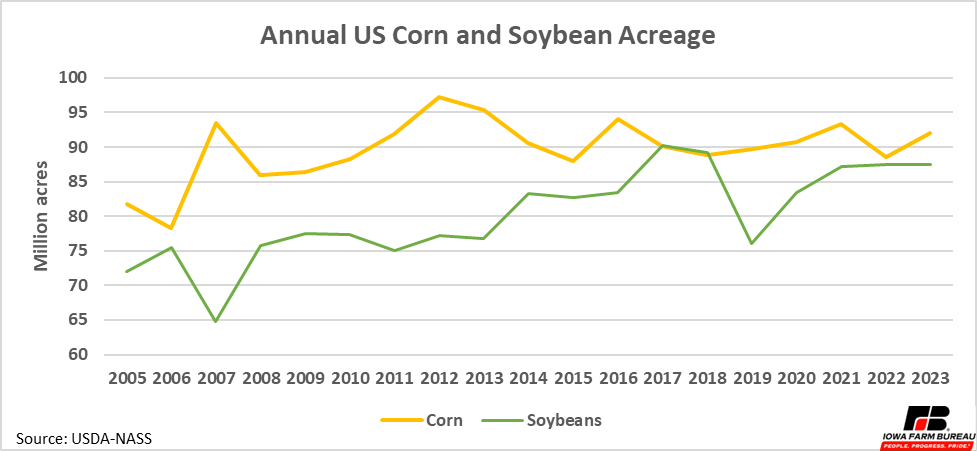
Figure 1. Annual US Field Crop Acreage
Iowa is projected to plant 13.1 million acres of corn, up 1.6% from last year. Iowa soybean acres are projected to be unchanged from last year at 10.1 million acres. This represents the majority of field crops in Iowa as Iowa is projected to plant 24.5 million total field crops, leaving a projected 1.3 million acres of other field crops in 2023.
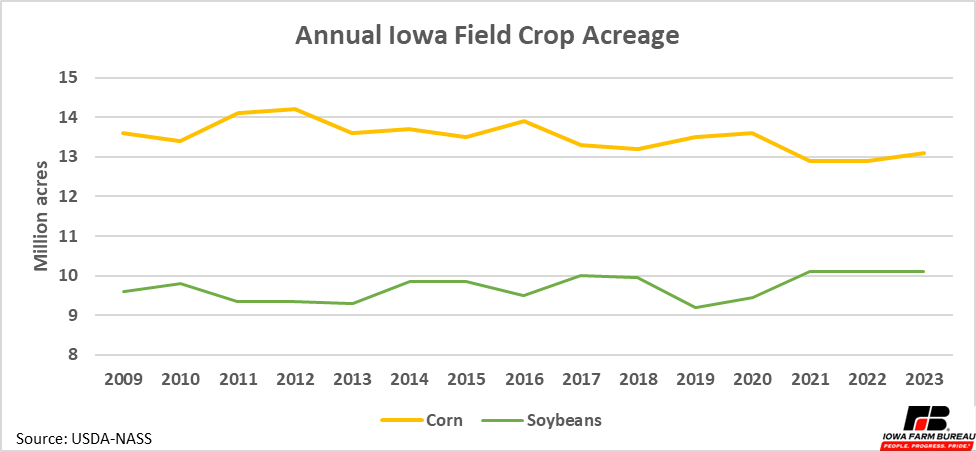
Figure 2. Annual Iowa Corn and Soybean Acreage
With a large projected increase in US corn acres, most states are expected to have more corn compared to last year (Figure 3). North Dakota is projected to have the largest increase of about 800,000 acres. Minnesota, Indiana, Iowa, and Illinois are also expected to have sizable increased in acres. Nebraska and Texas are the only states that are expected to have sizable decreases in corn acres. Though other states like Nevada, Montana, and Florida are expected to have smaller decreases.
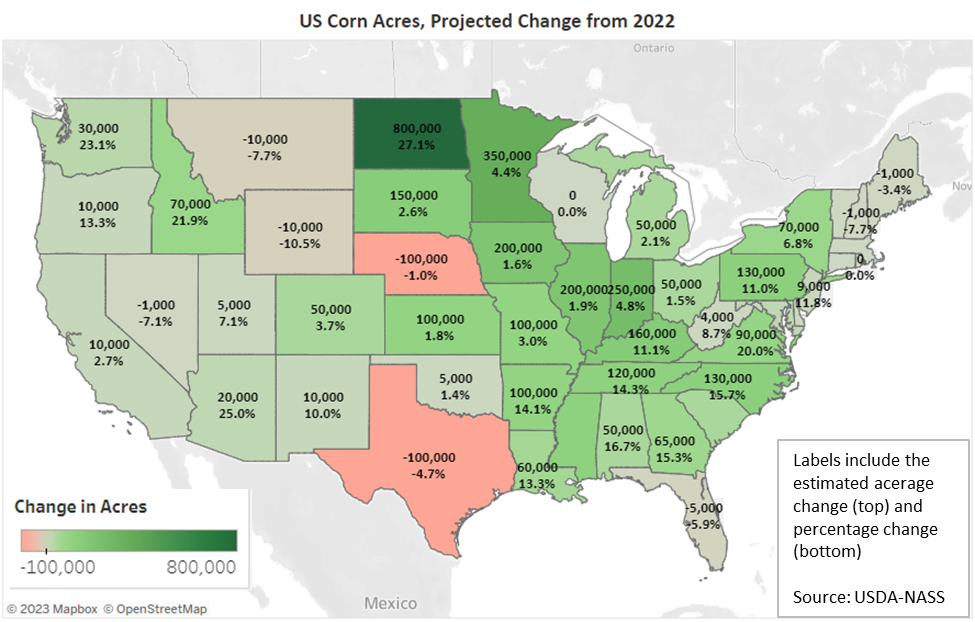
Figure 3. US Corn Acres, Projected Change from 2022
While US soybean acreage is only expected to increase slightly compared to last year, changes in planted acreage at the state level in mixed. North Dakota is expected to have the largest increase in soybean acres, with 850,000 additional acres. South Dakota, Minnesota, and Wisconsin are also expected to see notable increase in acres. Kansas is expected to see the largest decrease of 450,000 acres. Indiana, Michigan, Arkansas and Missouri are also expected to see large decreases in soybean acres.
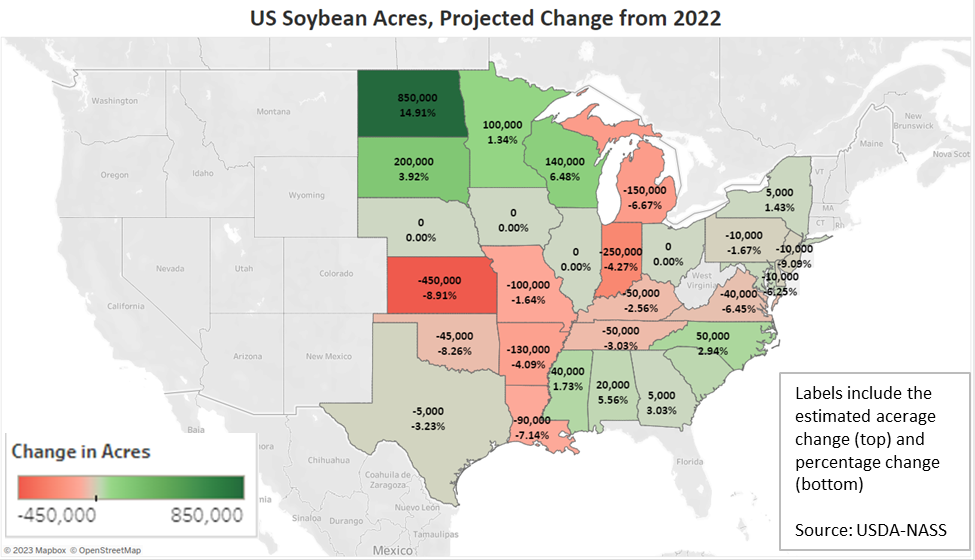
Figure 4. US Soybean Acres, Projected Change from 2022
History of Revisions
Revisions to the acreage estimate between now and January when the final estimate is made always occur. Figure 3 and Figure 4 show the difference between prospective planting acreage estimate in March and the final acreage estimate the following January for corn and soybeans, respectively, over the last 20 years. The average revision and the standard deviations of revisions over this period are also shown.
Revisions since 1993, on average, have been slightly negative for both corn and soybeans. Neither average is statistically different from zero, so the estimates are not biased. Unexpected events, especially weather, limits the ability to perfectly forecast acres to be planted. For example, wet springs that inhibit planting can cause forecast acres to be overestimated.
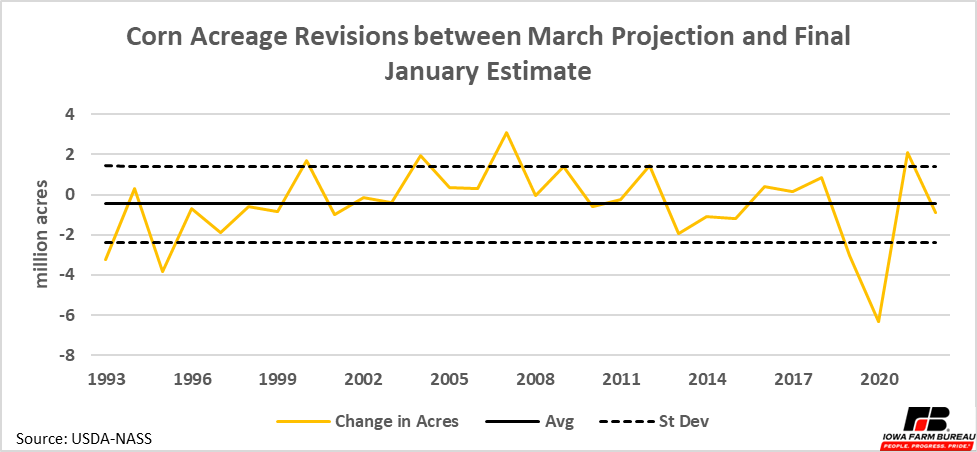
Figure 5. Corn Acreage Revisions from Mar to Jan
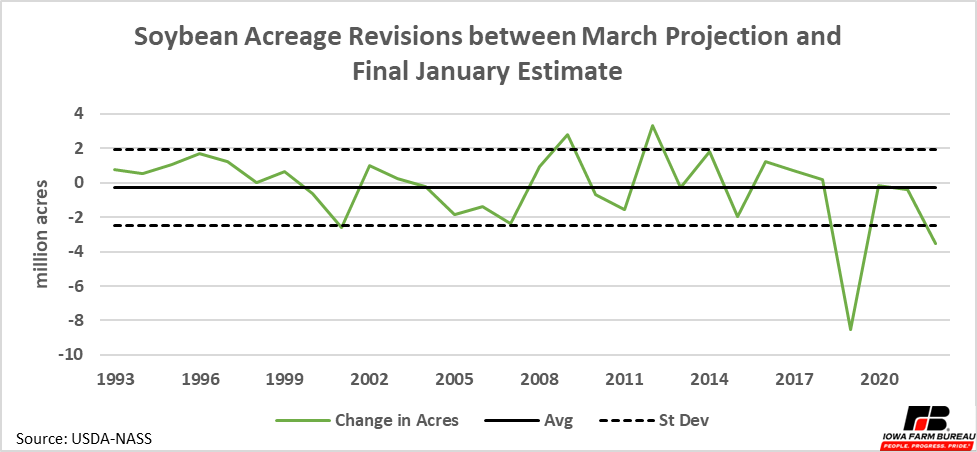
Figure 6. Soybean Acreage Revisions from Mar to Jan
One area to watch for acreage revisions may be in northern states like North Dakota and Minnesota. Planting intentions in both northern states show sizable increases in corn and soybean acres, but it is wise to remember that these are just “intentions” and intentions may not translate into actual plantings this year. Both states have planted as many or more acres of corn and soybeans compared to this year’s projections in the past. However, there is a substantial snow pack in those states and cold or wet spring weather can cause more acres than expected to eventually become prevent plant acres, as was the case last year. This spring has also been cold and wet to start the year in both states. We will have to wait and see if weather conditions allow for corn and soybean acreage estimates, or if estimates are adjusted down in the future.
Want more news on this topic? Farm Bureau members may subscribe for a free email news service, featuring the farm and rural topics that interest them most!